
Concept explainers
Videos
a.
Find the possible number of different samples when a fair die is rolled tow times.
a.
Answer to Problem 40CE
The possible number of different samples when a fair die is rolled two times is 36:
Explanation of Solution
From the given information, the fair die is rolled two times.
A fair die has 6 sides.
Then, the possible number of different samples when a fair die is rolled two times is obtained by using the following formula:
Thus, the possible number of different samples when a fair die is rolled two times is 36:
b.
Give the all possible samples.
Find the mean of each sample.
b.
Answer to Problem 40CE
All possible samples are
The mean of each sample is 1, 1.5, 2, 2.5, 3, 3.5, 1.5, 2, 2.5, 3, 3.5, 4, 2, 2.5, 3, 3.5, 4, 4.5, 2.5, 3, 3.5, 4, 4.5, 5, 3, 3.5, 4, 4.5, 5, 5.5, 3.5, 4, 4.5, 5, 5.5 and 6.
Explanation of Solution
The mean is calculated by using the following formula:
| Sample | Mean |
Thus, all possible samples are
Thus, the mean of each sample is 1, 1.5, 2, 2.5, 3, 3.5, 1.5, 2, 2.5, 3, 3.5, 4, 2, 2.5, 3, 3.5, 4, 4.5, 2.5, 3, 3.5, 4, 4.5, 5, 3, 3.5, 4, 4.5, 5, 5.5, 3.5, 4, 4.5, 5, 5.5 and 6.
c.
Give the comparison between the distribution of sample means and the distribution of the population.
c.
Answer to Problem 40CE
The shape of the distribution of the sample means is normal.
The shape of the population distribution is uniform.
Explanation of Solution
A frequency distribution for the sample means is obtained as follows:
Let
| Sample mean | f | Probability |
| 1 | 1 | |
| 1.5 | 2 | |
| 2 | 3 | |
| 2.5 | 4 | |
| 3 | 5 | |
| 3.5 | 6 | |
| 4 | 5 | |
| 4.5 | 4 | |
| 5 | 3 | |
| 5.5 | 2 | |
| 6 | 1 | |
Software procedure:
Step-by-step procedure to obtain the bar chart using MINITAB:
- Choose Stat > Graph > Bar chart.
- Under Bars represent, enter select Values from a table.
- Under One column of values select Simple.
- Click on OK.
- Under Graph variables enter probability and under categorical variable enter sample mean.
- Click OK.
Output using MINITAB software is given below:
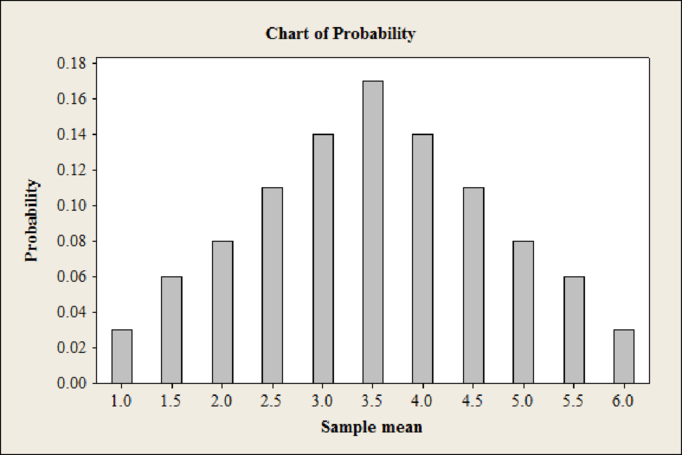
From the bar chart it can be observed that the shape of the distribution of the sample means is normal.
Thus, the shape of the distribution of the sample means is normal.
From the given information, population values can be 1, 2, 3, 4, 5 and 6.
| Face value | f | Probability |
| 1 | 1 | |
| 2 | 1 | |
| 3 | 1 | |
| 4 | 1 | |
| 5 | 1 | |
| 6 | 1 | |
Software procedure:
Step-by-step procedure to obtain the bar chart using MINITAB:
- Choose Stat > Graph > Bar chart.
- Under Bars represent, enter select Values from a table.
- Under One column of values select Simple.
- Click on OK.
- Under Graph variables enter probability and under categorical variable enter Face value.
- Click OK.
Output using MINITAB software is given below:
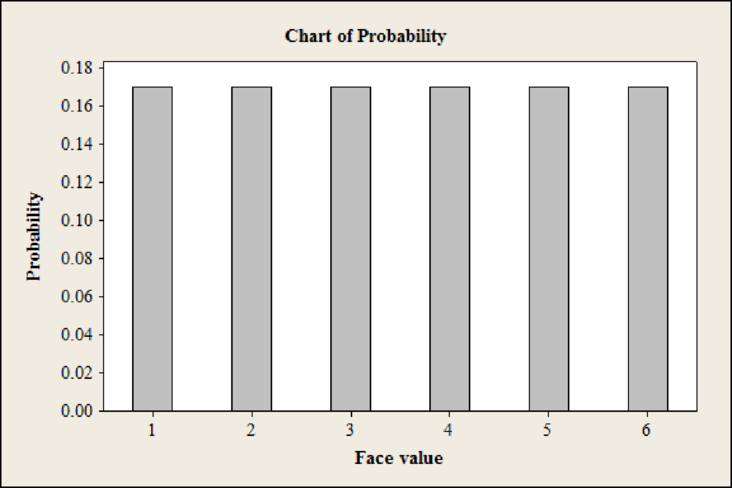
From the bar chart it can be observed that the shape of the population distribution is uniform.
Thus, the shape of the population distribution is uniform.
d.
Find the mean and the standard deviation of each distribution.
Give the comparison between the mean and standard deviation of each distribution.
d.
Answer to Problem 40CE
The mean and standard deviation of the population distribution is 3.5 and 1.871.
The mean and standard deviation of the sampling distribution is 3.5 and 1.225.
The mean of the population distribution is exactly same as the population distribution. The standard deviation of the population distribution is greater than the population distribution.
Explanation of Solution
Software procedure:
Step-by-step procedure to obtain the mean and variance using MINITAB:
- Choose Stat > Basic statistics > Display
Descriptive statistics . - Under Variables, enter Face value.
- Click on Statistics. Select Mean and Standard deviation.
- Click OK.
Output using MINITAB software is given below:
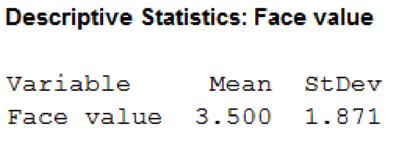
From the MINITAB output, the mean and standard deviation of the population distribution is 3.5 and 1.871.
Step-by-step procedure to obtain the mean and variance using MINITAB:
- Choose Stat > Basic statistics > Display Descriptive statistics.
- Under Variables, enter the column of Sample mean.
- Click on Statistics. Select Mean and Standard deviation.
- Click OK.
Output using MINITAB software is given below:
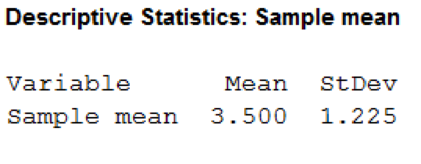
From the MINITAB output, the mean and standard deviation of the sampling distribution is 3.5 and 1.225.
Thus, the mean and standard deviation of the population distribution is 3.5 and 1.871.
Thus, the mean and standard deviation of the sampling distribution is 3.5 and 1.225.
Comparison:
The mean and standard deviation of the population distribution is 3.5 and 1.871. The mean and standard deviation of the sampling distribution is 3.5 and 1.225.
Thus, the mean of the population distribution is exactly same as the population distribution. The standard deviation of the population distribution is greater than the population distribution.
Want to see more full solutions like this?
Chapter 8 Solutions
STAT.TECH.BUS.+ECON.(LL)W/CONNECT ACCES


 Glencoe Algebra 1, Student Edition, 9780079039897...AlgebraISBN:9780079039897Author:CarterPublisher:McGraw Hill