Concept explainers
Videos
Consider the project described by the digraph shown in Fig. 8-38, and assume that you are to schedule this project using
a. Use the decreasing-time algorithm to schedule the project. Show the timeline for the project and finishing time
b. Find an optimal schedule and the optimal finishing time
c. Use the relative error formula
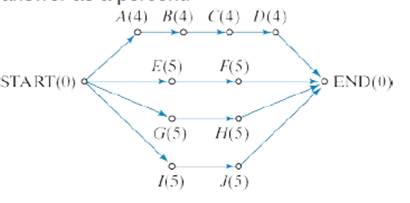
Figure 8-38
Want to see the full answer?
Check out a sample textbook solution
Chapter 8 Solutions
Student's Solutions Manual For Excursions In Modern Mathematics Format: Paperback


- In a lumberjack competition, a contestant is blindfolded and spun around 9 times. The blindfolded contestant then tries to hit the target point in the middle of a horizontal log with an axe. The contestant receives 15 points if his hit is within 3 cm of the target, 10 points if his hit is between 3 cm and 10 cm of the target, 5 points if his hit is between 10 cm and 20 cm of the target, and Zero points if his hit is 20 cm or more away from the target. Let Y record the position of the hit, so that Y=y>0 corresponds to missing the target point to the right by y cm Y=-y<0 corresponds to missing the target to the left by y cm. Assume that Y is normally distributed with mean mu=0 and variance 100 cm2. Find the expected number of points that the contestant wins.arrow_forwardSolve the following linear program graphically:Maximize P = 4X1 + 6X2Subject to X1+ X2 < 6 ---------- (1) (labor)3X1 + 2X2 < 15 --------- (2) (machine time)X1 < 4 ---------- (3) (finishing time)X2 < 5 ---------- (4) (assembly time)Where X1, X2 > 0arrow_forwardThe call center of a small manufacturer receives calls randomly at an average rate of 9 customers per hour. The arriving calls are answered by a single agent randomly with an average service rate of 12 customers per hour. Answer the following questions assuming that the system can be modeled as an M/M/1 queue. average waiting time in queue (in minutes): minimum integer service rate (number of customers served per hour) such that the average waiting time in queue is less than 7 minutes:arrow_forward
- Use the following information for questions 3-6. The columns indicate the number of trains running. Total railroad profits are the total profits to the railroad from running the specified number of trains. Total lost farmer profits are total profits the farmer loses from a specified number of trains running. Trains 1 2 3 Total Railroad Profit $100 $200 $300 Total Lost Profit for Farmer $40 $130 $250 What is the socially optimal number of trains? A. 0 B. 1 C. 2 D. 3arrow_forwardQ2. Suppose you have been appointed the County Executive in charge of finance in your County. You have allocated funding to two projects, Project A and Project B. By coincidence, Project B happens to be located in your Sub- County. Given below are seventy allocations to various activities in both projects (in Kshs Billions). Funding for Project A 96 21 80 38 20 60 21 50 100 15 81 06 55 40 70 70 10 30 30 35 66 53 50 60 80 35 80 55 50 49 51 60 25 90 90 50 95 50 80 65 60 55 20 30 110 65 50 65 60 80 64 50 66 35 40 60 65 50 51 81 36 90 51 80 50 55 80 30 60 96 Funding for Project B 20 66 59 21 101 108 31 65 34 20 35 80 63 36 95 89 61 48 44 25 50 81 68 59 50 15 21 29 54 50 45 55 80 65 40 29 81 20 104 65 51 60 10 45 60 35 96 55 24…arrow_forwardSolve the following linear program graphically:Maximize P = 4X1 + 2X2Subject to X1 + 2X2 < 6 ---------- (1) (machine time)2X1 + 2X2 < 8 ---------- (2) (labor)Where X1, X2 > 0 2. Solve the following linear program graphically:Maximize P = 4X1 + 1X2Subject to 2X1 + 4X2 < 24 ---------- (1) (resource A)6X1 + 3X2 < 36 ---------- (2) (resource B)Xl < 5 ----------- (3) (resource C)2X2 < 10 ----------- (4) (resource D)where X1, X2 > 0arrow_forward
 Linear Algebra: A Modern IntroductionAlgebraISBN:9781285463247Author:David PoolePublisher:Cengage Learning