
Videos
To find: The box-plot for the four pollutants to verify that the assumptions for constructing a confidence interval are satisfied and the
Answer to Problem 4CS
The box-plot for the four pollutants is shown in Figure-1 and assumptions for constructing a confidence interval are satisfied and
Explanation of Solution
Given information:
The number of pollutants is
| Year 1 | Year 2 | ||||||
| PM | OC | TC | LE | PM | OC | TC | LE |
| 21.7 | 15.6 | 17.73 | 1.78 | 27.0 | 15.79 | 19.46 | 2.06 |
| 27.8 | 15.6 | 17.87 | 2.25 | 24.7 | 13.61 | 15.98 | 3.10 |
| 24.7 | 17.2 | 18.75 | 1.98 | 21.8 | 12.94 | 15.79 | 2.68 |
| 15.3 | 8.3 | 9.21 | 0.67 | 23.2 | 12.97 | 16.32 | 2.80 |
| 18.4 | 11.3 | 12.46 | 0.86 | 23.3 | I l.19 | 13.49 | 2.07 |
| 14.4 | 8.4 | 9.66 | 1.93 | 16.2 | 9.61 | 12.44 | 2.14 |
| 19.0 | 13.2 | 14.73 | 1.51 | 13.4 | 6.97 | 8.40 | 2.32 |
| 23.7 | 1 1.4 | 13.23 | 1.98 | 13.0 | 7.96 | 10.02 | 2. 18 |
| 22.4 | 13.8 | 17.08 | 1.69 | 16.9 | 8.43 | 11.08 | 2.06 |
| 25.6 | 13.2 | 15.86 | 2.30 | 26.3 | 14.92 | 21.46 | 1.94 |
| 15.0 | 15.7 | 17.27 | 1.24 | 31.4 | 17.15 | 20.57 | 1.85 |
| 17.0 | 9.3 | 10.2 1 | 1.44 | 40. l | 15.13 | 19.64 | 2. 1 1 |
| 23.2 | 10.5 | 11.47 | 1.43 | 28.0 | 8.66 | 10.75 | 2.50 |
| 17.7 | 14.2 | 15.64 | 1.07 | 4.2 | 15.95 | 20.36 | 2.27 |
| 11.l | 11.6 | 13.48 | 0.59 | 15.9 | 11.73 | 14.59 | 2.17 |
| 29.8 | 7.0 | 7.795 | 2.10 | 20.5 | 14.34 | 17.64 | 2.74 |
| 20.0 | 19.9 | 21.20 | 1.73 | 23.8 | 8.99 | 1 1.75 | 2.45 |
| 21.6 | 14.8 | 15.65 | 1.56 | 14.6 | 10.63 | 13.12 | |
| 14.8 | 12.6 | 13.51 | 1.1 | 17.8 | |||
| 21.0 | 9.1 | 9.94 | |||||
Concept used:
MINITAB is used.
Calculation:
The procedure for box-plot is, choose graph then box-plot, under the multiple Y’s choose simple and click ok.
In graph variables, enter the data of PM, OC, TC and LE and click ok.
The Box-plot is shown below.
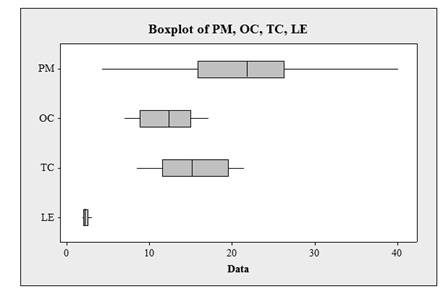
Figure-1
From Figure-1, there is no sign of strong skews and no outliers.
The
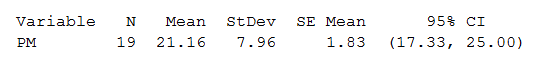
Figure-2
The
The
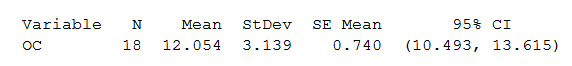
Figure-3
The
The
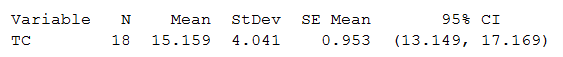
Figure-4
The
The
Figure-5
The
Therefore, the box-plot for the four pollutants is shown in Figure-1 and assumptions for constructing a confidence interval are satisfied and
Want to see more full solutions like this?
Chapter 8 Solutions
ELEMENTARY STATISTICS-ACCESS CARD PKG


- Table 6 shows the year and the number ofpeople unemployed in a particular city for several years. Determine whether the trend appears linear. If so, and assuming the trend continues, in what year will the number of unemployed reach 5 people?arrow_forwardUse this data for the exercises that follow: In 2013, there were roughly 317 million citizens in the United States, and about 40 million were elderly (aged 65 and over).[34] 60. It is predicted that by 2030, one in five U.S. citizens will be elderly. How much greater will the chances of meeting an elderly person be at that time? What policy changes do you foresee if these statistics hold true?arrow_forward
 Holt Mcdougal Larson Pre-algebra: Student Edition...AlgebraISBN:9780547587776Author:HOLT MCDOUGALPublisher:HOLT MCDOUGAL
 Glencoe Algebra 1, Student Edition, 9780079039897...AlgebraISBN:9780079039897Author:CarterPublisher:McGraw Hill
 Big Ideas Math A Bridge To Success Algebra 1: Stu...AlgebraISBN:9781680331141Author:HOUGHTON MIFFLIN HARCOURTPublisher:Houghton Mifflin Harcourt
 Trigonometry (MindTap Course List)TrigonometryISBN:9781305652224Author:Charles P. McKeague, Mark D. TurnerPublisher:Cengage Learning
 Functions and Change: A Modeling Approach to Coll...AlgebraISBN:9781337111348Author:Bruce Crauder, Benny Evans, Alan NoellPublisher:Cengage Learning