
Videos
Consider the project described by the project digraph shown in Fig.
a. Find the critical path and critical time for the project.
b. Find the critical-time priority list.
c. Schedule the project with
d. Find an optimal schedule for
e. Use the relative error formula
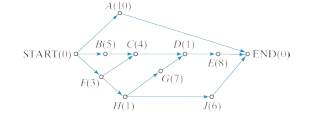
Figure
Want to see the full answer?
Check out a sample textbook solution
Chapter 8 Solutions
MYLAB MATH FOR EXCURSIONS IN MATHEMATIC


- B7.arrow_forwardshow the work of part a and b and explainarrow_forwardA company manufactures a product at its plants in A, B, and C, then ships the product to six customers in G, H, J, K, and L, The monthly capacity of plants A, B, and Care 7400, 7300, and 10000 units, respectively. The monthly demand from customers G, H, J, K, and Lare 3000, 500, 4600, 7500, and 8900 units, respectively. Use Excel Solver to find the optimal distribution plant that will give the lowest total monthly shipping cost if the shipping cost per unit (in dollars per unit) are as follows: - from A to G, H, J, K, and L are 4, 9, 20, 6, and 13 dollars per unit, respectively; from B to G, H, J, K, and L are 12, 7, 3, 10, and 6 dollars per unit, respectively; from C to G, H, J, K, and L are 7, 6, 12, 2, and 9 dollars per unit, respectively. - The optimal total shipping costs is dollars per month.arrow_forward
- An optimization study is conducted for a plant layout and operations. The final design for the operations layout may have several options. The process will initially utilize six devices running at the same time, then, five groups of employs will conduct manually the final process. State the possible number of different process routes that will be adopted. Select one:arrow_forwardplease do this by hand, not in excelarrow_forwardSuppose that a company needs 1,800,000 items during a year and that preparation for each production run costs $500. Suppose also that it costs $14 to produce each item and $2 per year to store an item. Use the inventory cost model to find the number of items in each production run so that the total costs of production and storage are minimized. items/runarrow_forward
- A family is relocating from St. Louis, Missouri, to California. Due to an increasing inventory of houses in St. Louis, it is taking longer than before to sell a house. The wife is concerned and wants to know when it is optimal to put their house on the market. Her realtor friend informs them that the last 22 houses that sold in their neighborhood took an average time of 190 days to sell. The realtor also tell them that based on her prior experience, the population standard deviation is 72 days. Assume the number of days to sell a house has a normal distribution Find the lower bound of the 95% confidence interval for the mean sale time for all homes in the neighborhood Find the upper bound of the 95% confidence interval for the mean sale time for all homes in the neighborhood.arrow_forwardA family is relocating from St. Louis, Missouri, to California. Due to an increasing inventory of houses in St. Louis, it is taking longer than before to sell a house. The wife is concerned and wants to know when it is optimal to put their house on the market. Her realtor friend informs them that the last 22 houses that sold in their neighborhood took an average time of 190 days to sell. The realtor also tell them that based on her prior experience, the population standard deviation is 72 days. Calculate the margin of error for a 95% confidence interval for the mean.arrow_forwardquestion 1 pleasearrow_forward
- Tailwind, Inc., produces high-quality but expensive training shoes for runners. The Tailwind shoe, which sells for $210, contains both gas- and liquid-filled compartments to provide more stability and better protection against knee, foot, and back injuries. Manufacturing the shoes requires 10 separate tasks. There are 400 minutes available for manufacturing the shoes in the plant each day. Daily demand is 62. The information for the tasks is as follows: Fig. 1 Task A Performance Time (mins) 1 Predecessors 3 A 1 B B C, D A F Н G 1 4 E, H | 42326- BCDEFGHI - J a-b) The correct precedence relationship with one of the possible assignments of tasks using the "ranked positioned weight" to workstations is shown in c) The efficiency of the assembly line with 5 workstations shown in the figure chosen above= % (enter your response as a percentage rounded to one decimal place). d) The idle time for the assembly line per cycle = ☐ minute(s) (enter your response as a whole number). ☑ B E H → Fig. 2…arrow_forwardUsing the priority list T3, T6, T3, T1, T5, T2, T9, T10, T7, T4, schedule the project below with two 8 processors. T1 (6) T5 (9) Т9 (4) T2 (8) Т6 (5) T8 (10) T10 (3) End Т3 (11) T7 (2) T4 (12) Task 6 is done by Select an answer v starting at time Task 8 is done by Select an answer v starting at timearrow_forwardSuppose a furniture builder has two models of a bookcase: standard and artisan. The standard model requires 5 hours to assemble and 1 hours for finishing touches. The artisan model requires 2 hours to assemble and 4 hours for finishing touches. Based on their current staffing, they can manage a maximum number of assembly hours available is 50 per day, and the maximum number of finishing hours available is 64 per day. Let x = the number of standard model bookcases produced per day and y = the number of artisan model bookcases produced per day. Write the system of inequalities that represents the maximum number of bookcases that can be produced in one day. 0 Graph the system of inequalities, remember to include x >0 and y > 0 in your graph to get full credit. You will need to include four lines. 25 24 VIarrow_forward
 Algebra & Trigonometry with Analytic GeometryAlgebraISBN:9781133382119Author:SwokowskiPublisher:Cengage