
Videos
Use the following information to answer the next 13 exercises: The data In Table 8.10 are the result of a random survey of 39 national flags (with replacement between picks) from various countries. We are interested in finding a confidence interval for the true mean number of colors on a national flag. Let X = the number of colors on a national flag.
| X | Freq. |
| 1 | 1 |
| 2 | 7 |
| 3 | 18 |
| 4 | 7 |
| 5 | 6 |
Table 8.10
Construct a 95% confidence interval for the true mean number of colors on national flags.
58. Fill In the blanks on the graph with the areas, the upper and lower limits of the Confidence Interval and the sample mean.
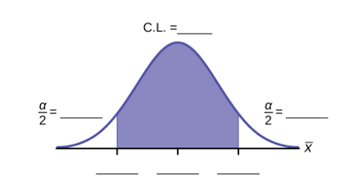
Figure 8.9

Trending nowThis is a popular solution!

Chapter 8 Solutions
Introductory Statistics
Additional Math Textbook Solutions
Calculus Volume 1
Fundamentals of Statistics (5th Edition)
Elementary Statistics: Picturing the World (6th Edition)
Essentials of Statistics, Books a la Carte Edition (5th Edition)
Introductory Statistics (10th Edition)


 Glencoe Algebra 1, Student Edition, 9780079039897...AlgebraISBN:9780079039897Author:CarterPublisher:McGraw Hill