
Concept explainers
Videos
Table 8.1 Spreadsheet HomeNet’s Incremental Earnings
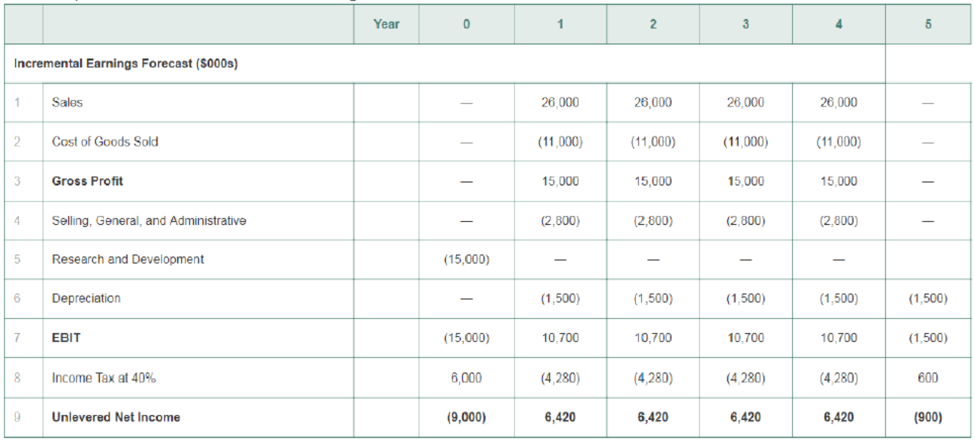
5. After looking at the projections of the HomeNet project, you decide that they are not realistic. It is unlikely that sales will be constant over the four-year life of the project. Furthermore, other companies are likely to offer competing products, so the assumption that the sales price will remain constant is also likely to be optimistic. Finally, as production ramps up, you anticipate lower per unit production costs resulting from economies of scale. Therefore, you decide to redo the projections under the following assumptions: Sales of 50,000 units in year 1 Increasing by 50,000 units per year over the life of the project, a year 1 sales price of $260/unit, decreasing by 10% annually and a year 1 cost of $120/ unit decreasing by 20% annually. In addition, new tax laws allow you to
- a. Keeping the other assumptions that underlie Table 8.1 the same, recalculate unlevered net income (that is, reproduce Table 8.1 under the new assumptions, and note that we are ignoring cannibalization and lost rent).
- b. Recalculate unlevered net income assuming, in addition, that each year 20% of sales comes from customers who would have purchased an existing Cisco router for $100/unit and that this router costs $60/unit to manufacture.
Want to see the full answer?
Check out a sample textbook solution
Chapter 8 Solutions
Corporate Finance (4th Edition) (Pearson Series in Finance) - Standalone book


- Scenario Analysis Shao Industries is considering a proposed project for its capital budget. The company estimates the projects NPV is 12 million. This estimate assumes that the economy and market conditions will be average over the next few years. The companys CFO, however, forecasts there is only a 50% chance that the economy will be average. Recognizing this uncertainty, she has also performed the following scenario analysis: What are the projects expected NPV, standard deviation, and coefficient of variation?arrow_forwardExcel Project and Excel Solution Ten annual returns are listed below.-19.9% 16.6% 18.0%-50.0% 43.3% 1.2%-16.5% 45.6% 45.2%-3.0% What is the arithmetic average return over the 10-year period? What is the geometric average return over the 10-year period? If you invested $100 at the beginning of the period, how much would you have at the end?arrow_forward6b) Kalvino Inc. has a new five-year project that produces high-end raincoats. The initial investment equals $85,000. The estimated selling price equals $102 per unit and variable costs equal $80 per unit. Fixed costs equal $29,000. Investors do require a 15% return. Calculate the cash break-even quantity? Interpret your answer. Calculate the accounting break-even quantity? Interpret your answer. Calculate the financial break-even quantity? Interpret your answer. What is the degree of operating leverage for this project? Assuming that sales are estimated at $249,900.arrow_forward
- You estimate that a planned project for your company has a 0.3 chance of tripling the investment in a year and a 0.7 chance of halving the investment in a year. What is the standard deviation of the return on this project? A.1.5625 B.1.3126 C.1.2247 D.1.1457arrow_forwardScenarios: You work in the macroeconomic research department of an investment bank. Based on your modelling of the economy, you think that in the next few months US GDP will evolve according to three basic scenarios: Scenario A: GDP will rise 3%. This will send the S&P ETF to 414. Scenario B: GDP will stagnate. S&P ETF will stay at 407. Scenario C: GDP will fall 2%. This will send the S&P ETF to 400. Question 3 You build an “Iron Condor” strategy with February maturity combining the following positions: a long put at 405 a short put at 406 a short call at 408 a long call at 409 Draw the payoff and net payoff of the Iron Condor strategy. Compute the payoff and net payoff of this strategy in the three scenarios. Use the data in Table 2. Please show your calculations. Discuss your result.arrow_forward13. Project Analysis You are considering a new product launch. The project will cost $1.675 million, have a four-year life, and have no salvage value; depreciation is straight-line to zero. Sales are projected at 195 units per year; price per unit will be $16,300; variable cost per unit will be $9,400; and fixed costs will be $550,000 per year. The required return on the proiect is 12 percent and the relevant tax rate is 21 percent. a. Based on your experience, you think the unit sales, variable cost, and fixed cost projections given here are probably accurate to within #10 percent. What are the upper and lower bounds for these projections? What is the base-case NPV? What are the best-case and worst-case scenarios? b. Evaluate the sensitivity of your base-case NPV to changes in fixed costs. c. What is the accounting break-even level of output for this project? use excel to solve thisarrow_forward
- ASAP!! The most likely outcomes for a particular project are estimated as follows: Unit price: $50 Variable cost: $30 Fixed cost: $300,000 Expected sales: 30,000 units per year However, you recognize that some of these estimates are subject to error. Suppose that each variable may turn out to be either 12 percent higher or 12 percent lower than the initial estimate. The project will last for 5 years and requires an initial investment of $1 million, which will be depreciated straight-line over the project life to a final value of zero. The firm’s tax rate is 35 percent and the required rate of return is 12 percent. What is project NPV in the “best-case scenario,” that is, assuming all variables take on the best possible value? What about the worst-case scenario?arrow_forwardQuestion 31 RWJ 9-8 MC Given the forecast cash flows of the Covina Donuts, what is the profitability index for assuming a discount rate of 14.50? Year Cash Flow 0 -$46,500 1 $12,200 2 $38,400 3 $11,300 Group of answer choices 0.97 1.06 0.93 1.02 Question 32 RWJ 9-1 MCMaria is examining a graph that shows the NPVs of a technology project against different required rates of return. What is this graph called? Group of answer choices Project return vs risk profile Project Rate of return profile IRR profile NPV profilearrow_forwardTime to grow: Zephyr Sales Company has currently reported sales of $1.125 million. If the company expects its sales to grow 6.5 percent annually, how long will it be before the company can double its sales? Use a financial calculator to solve this problem.arrow_forward
 Intermediate Financial Management (MindTap Course...FinanceISBN:9781337395083Author:Eugene F. Brigham, Phillip R. DavesPublisher:Cengage Learning
