
Videos
(a)
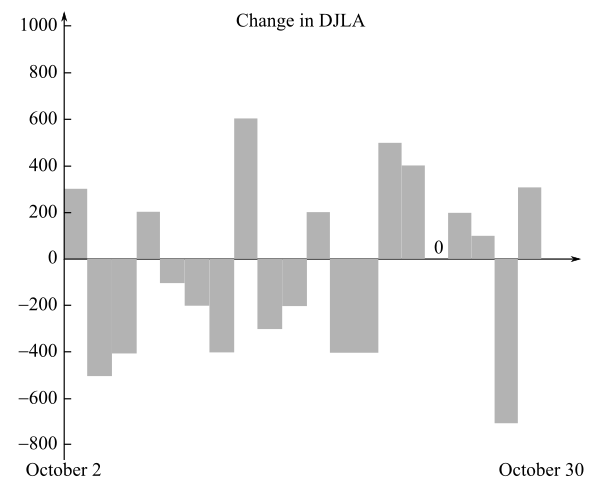
The values of X if X is the (rounded) change in the Dow on a randomly selected day where the chart shows the day-by-day change, rounded to the nearest
(b)
To calculate: The frequency and probability distributions of X if X is the (rounded) change in the Dow on a randomly selected day where the chart shows the day-by-day change, rounded to the nearest
(c)
To calculate: The probability that on a randomly selected day, the Dow decreased by more than

Trending nowThis is a popular solution!

Chapter 8 Solutions
Bundle: Finite Mathematics, Loose-leaf Version, 7th + WebAssign Printed Access Card for Waner/Costenoble's Finite Mathematics, 7th Edition, Single-Term


- The annual revenue of Amazon is given in the table below (sourceLinks to an external site.). Year Amazon Annual Revenue(Billions of US dollars) 2020 386.064 2019 280.522 2018 232.887 2017 177.866 2016 135.987 2015 107.006 2014 88.988 2013 74.452 2012 61.093 2011 48.077 2010 34.204 In what year will the estimated revenue of Amazon be 1,357 billion US dollars? Note: I am asking for the year, not the number of years since 2010. This may happen between two years. Round to the nearest year.arrow_forwardUsing the data in Table 6–11, calculate a 3-month moving average forecast for month 12.arrow_forwardA stock has monthly returns of 9%, 22%, 15%, and 28%. What is the stock's geometric average return?arrow_forward
- The revenue for Google for the years 2010–2014 is shown in the following table (Wallstreet Journal, August 2014). Deflate the revenue in dollars based on the CPI (1982–1984base period). Comment on the company’s revenue in deflated dollars. Year Revenue ($ billions) CPI2010 29.3 218.12011 37.9 224.92012 50.2 229.62013 59.8 233.02014 66.7 236.7arrow_forwardWhat do the Forecast for each year add up to?arrow_forward2.5 2.0 15 1.0 0.5 Incarcerated Americans 1920-2014 Prison Jail 0 1920 1930 1940 1950 1960 1970 1980 1990 2000 2010 Year Juvenile Detention 6. Describe the trend depicted in this ch 7. What impact do you think this trend has had on the public defender system? depicarrow_forward
- Top of Form a)Plot the monthly sales data. b)Forecast January sales using each of the following: i)Naive method. ii)A 3-month moving average. iii)A 6-month weighted average using .1, .1, .1, .2, .2, and .3, with the heaviest weights applied to the most recent months. iv)Exponential smoothing using an α = .3 and a September forecast of 18.arrow_forwardBuilding Year of sale 1 2005 1 2005 2 2007 2007 2004 2007 2007 2008 2008 2008 ID Property # Area (ft.) Price 1030 11 Apartment 30 743.09 $ 246,172.68 1029 10 Apartment 29 756.21 $ 246,331.90 2002 7 Apartment 2 587.28 $ 209,280.91 2031 12 Apartment 31 1604.75 $ 452,667.01 1049 11 Apartment 49 1375.45 $ 467,083.31 3011 9 Apartment 11 675.19 $ 203,491.85 3026 9 Apartment 670.89 $ 212,520.83 3023 1 Apartment 720.81 $ 198,591.85 1031 6 Apartment $ 265,467.68 782.25 794.52 4023 3 Apartment $ 235,633.26 Customer Entity Name Surname Interval Gender Country State ID C0028 Individual Madalyn Mercer 19 18-25 F USA California Home C0027 Individual Lara Carrillo 22 18-25 F USA California Home C0112 Individual Donavan Flowers 22 18-25 M USA California Home C0160 Individual Darien Dorsey 22 18-25 M USA California Investment C0014 Individual Alessandra Perry 25 18-25 F USA California Home C0125 Individual Kaitlin Owen 26 26-35 F USA Virginia Investment C0125 Individual Kaitlin Owen 26 26-35 F USA…arrow_forwardThe Following are the Index Numbers of prices (2002 = 100) %3D Year Index Year Index 2002 100 2007 410 2003 110 2008 400 2004 120 2009 380 2005 200 2010 370 2006 400 2011 340 Shift the base from 2002 – 2008 and recast the Index Numbers.arrow_forward
- a)Given the data 63, 64, 66, 67, 67, 69, 71, 72 are the units of actual sales of TV in the last eight periods. Find the forecast for the ninth period using simple exponential smoothing.Use α = 0.3 and initial forecast using simple average of last eight months. b)The sales of a company (in million dollars) for each year are shown in the table below. Find the linear sales trend line.x (year) 2005 2006 2007 2008 2009y (sales) 12 19 29 37 45 plz i need these answers within 4 hrs i need to submit them do the questions manually without using excel or minitabarrow_forwardA stock has monthly returns of 4%, 5%, 2%, and -3%. Its geometric average return is closest to: O 195 O 2.43 O 3.36 O 4.17arrow_forwardThe table shows the sales revenue from the past 8 quarters. What is the 4-period moving average forecast of the next quarter? Year 1 Year 2 Year 3 Q1 Q2 Q3 Q4 Q1 Q2 Q3 Q4 Q1 11 10 9 12 10 7 7 11 ?arrow_forward
 Linear Algebra: A Modern IntroductionAlgebraISBN:9781285463247Author:David PoolePublisher:Cengage Learning