
Videos
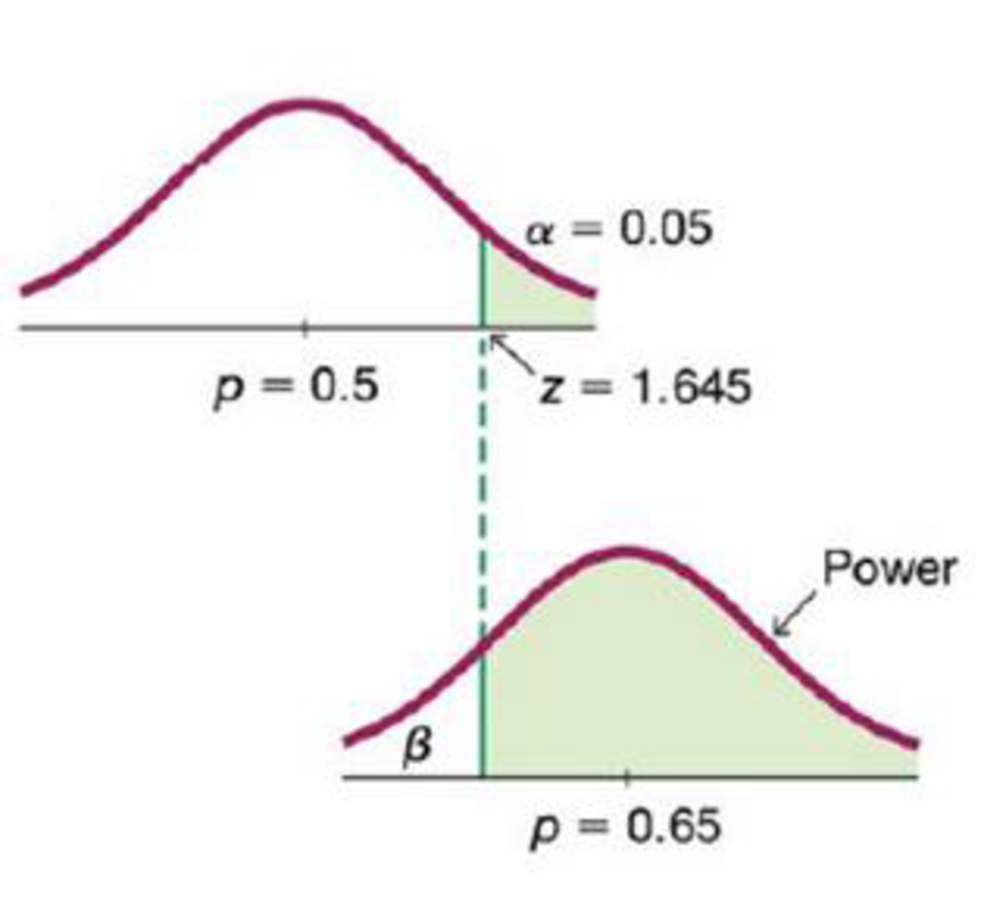
Calculating Power Consider a hypothesis test of the claim that the Ericsson method of gender selection is effective in increasing the likelihood of having a baby girl, so that the claim is p > 0.5. Assume that a significance level of α = 0.05 is used, and the sample is a simple random
a. Assuming that the true population proportion is 0.65, find the power of the test, which is the probability of rejecting the null hypothesis when it is false. (Hint: With a 0.05 significance level, the critical value is z = 1.645, so any test statistic in the right tail of the accompanying top graph is in the rejection region where the claim is supported. Find the sample proportion p in the top graph, and use it to find the power shown in the bottom graph.)
b. Explain why the green-shaded region of the bottom graph represents the power of the test.
Want to see the full answer?
Check out a sample textbook solution
Chapter 8 Solutions
Essentials of Statistics Plus MyLab Statistics with Pearson eText - Access Card Package (5th Edition)


 Calculus For The Life SciencesCalculusISBN:9780321964038Author:GREENWELL, Raymond N., RITCHEY, Nathan P., Lial, Margaret L.Publisher:Pearson Addison Wesley,