
Concept explainers
Videos
Application Exercises
The bar graphs show changes in educational attainment for Americans ages 25 and older from 1970 to 2007. Exercises 61–62 involve developing arithmetic sequences that model the data.
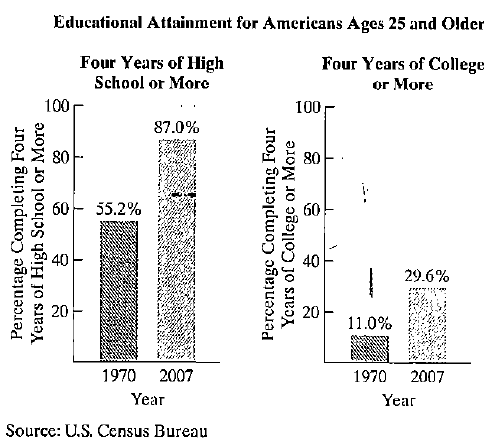
In 1970, 55.2% of Americans ages 25 and older had completed four years of high school or more. On average, this percentage has increased by approximately 086 each year.
a. Write a formula for the nth term of the arithmetic sequence that models the percentage of Americans ages 25 and older who had or will have completed four years of high school or more nyears after 1969.
b. Use the model from part (a) to project the percentage of Americans ages 25 and older who will have completed four years of high school or more by 2019.
Want to see the full answer?
Check out a sample textbook solution
Chapter 8 Solutions
Introductory and Intermediate Algebra for College Students


- 8–33. On Black Friday, Amazon.com featured an Echo 2nd Generation for $35 normally selling for $79. Calculate the dollar markdown and the markdown percent based on the selling price to the nearest whole percent.arrow_forward2.62 For the period 2001–2008, the Bristol-Myers Squibb Company, Inc. reported the following amounts (in billions of dollars) for (1) net sales and (2) advertising and product promotion. The data are also in the file XR02062. Source: Bristol-Myers Squibb Company, Annual Reports, 2005, 2008. Year Net Sales Advertising/Promotion 2001 $16.612 $1.201 2002 16.208 1.143 2003 18.653 1.416 2004 19.380 1.411 2005 19.207 1.476 2006 16.208 1.304 2007 18.193 1.415 2008 20.597 1.550 For these data, construct a line graph that shows both net sales and expenditures for advertising/product promotion over time. Some would suggest that increases in advertising should be accompanied by increases in sales. Does your line graph support this?arrow_forwardActivity 1.1 A. Write each as a decimal. Round off to the thousandths place. 1) 90% 4) 30% 2) 115.9% 5) 9% 3) 7% 6) 65%arrow_forward
- I. Starbucks Stores (Modeling) We all know that the number of Starbucks stores increased rapidly during 1992–2009. To see how rapidly, observe the following table, which gives the number of U.S. stores and the total number of stores during this period. Year Number of U.S. Stores Total Stores 1992 113 127 1993 163 183 1994 264 300 1995 430 483 1996 663 746 1997 974 1121 1998 1321 1568 1999 1657 2028 2000 2119 2674 2001 2925 3817 2002 3756 5104 2003 4453 6193 2004 5452 7567 2005 7353 10,241 2006 8896 12,440 2007 10,684 15,011 2008 11,567 16,680 2009 11,128 16,635 To investigate how the number of stores is likely to increase in the future and how the total number of stores compares with the number of U.S. stores, complete the following. 1. Create a scatter plot of the points (x, f (x)), with x equal to the number of the years past 1990…arrow_forwardI. Starbucks Stores (Modeling) We all know that the number of Starbucks stores increased rapidly during 1992–2009. To see how rapidly, observe the following table, which gives the number of U.S. stores and the total number of stores during this period. Year Number of U.S. Stores Total Stores 1992 113 127 1993 163 183 1994 264 300 1995 430 483 1996 663 746 1997 974 1121 1998 1321 1568 1999 1657 2028 2000 2119 2674 2001 2925 3817 2002 3756 5104 2003 4453 6193 2004 5452 7567 2005 7353 10,241 2006 8896 12,440 2007 10,684 15,011 2008 11,567 16,680 2009 11,128 16,635 To investigate how the number of stores is likely to increase in the future and how the total number of stores compares with the number of U.S. stores, complete the following. 1. Create a scatter plot of the points (x, f (x)), with x equal to the number of the years past 1990…arrow_forwardI. Starbucks Stores (Modeling) We all know that the number of Starbucks stores increased rapidly during 1992–2009. To see how rapidly, observe the following table, which gives the number of U.S. stores and the total number of stores during this period. Year Number of U.S. Stores Total Stores 1992 113 127 1993 163 183 1994 264 300 1995 430 483 1996 663 746 1997 974 1121 1998 1321 1568 1999 1657 2028 2000 2119 2674 2001 2925 3817 2002 3756 5104 2003 4453 6193 2004 5452 7567 2005 7353 10,241 2006 8896 12,440 2007 10,684 15,011 2008 11,567 16,680 2009 11,128 16,635 To investigate how the number of stores is likely to increase in the future and how the total number of stores compares with the number of U.S. stores, complete the following. 1. Create a scatter plot of the points (x, f (x)), with x equal to the number of the years past 1990…arrow_forward
- In 2010, MonsterCollege surveyed 1250 U.S.college students expecting to graduate in the next several years.Respondents were asked the following question:What do you think your starting salary will be at your firstjob after college?The line graph shows the percentage of college students whoanticipated various starting salaries. Use the graph to solveExercises 9–14. What starting salary was anticipated by the greatestpercentage of college students? Estimate the percentage ofstudents who anticipated this salary? What starting salary was anticipated by the least percentageof college students? Estimate the percentage of students whoanticipated this salary? What starting salaries were anticipated by more than 20% ofcollege students? Estimate the percentage of students who anticipated astarting salary of $40 thousand.arrow_forwardNational Debt The size of the total debt owed by the UnitedStates federal government continues to grow. In fact,according to the Department of the Treasury, the debt perperson living in the United States is approximately $53,000(or over $140,000 per U.S. household). The following datarepresent the U.S. debt for the years 2001–2014. Since thedebt D depends on the year y, and each input correspondsto exactly one output, the debt is a function of the year. SoD1y2 represents the debt for each year y. Source: www.treasurydirect.govDebt (billions Debt (billionsYear of dollars) Year of dollars)2001 5807 2008 10,0252002 6228 2009 11,9102003 6783 2010 13,5622004 7379 2011 14,7902005 7933 2012 16,0662006 8507 2013 16,7382007 9008 2014 17,824 (a) Plot the points 12001, 58072, 12002, 62282, and so on ina Cartesian plane.(b) Draw a line segment from the point 12001, 58072 to12006, 85072. What does the slope of this line segmentrepresent?(c) Find the average rate of change of the debt from 2002…arrow_forwardA stock has monthly returns of 9%, 22%, 15%, and 28%. What is the stock's geometric average return?arrow_forward
- Complete Part D A recent issue of the AARP Bulletin reported that the average weekly pay for a woman with a high school degree is $520 (AARP Bulletin, January–February, 2010). Suppose you would like to determine if the average weekly pay for all working women is significantly greater than that for women with a high school degree. Data providing the weekly pay for a sample of 50 working women are available in the file named WeeklyPay. These data are consistent with the findings reported in the AARP article. Complete D null hyposthesis: H(o)=520Alternative hypothesis: H(a): greater then 520 sample mean=637.94 the test statistic = 5.62 p-value=0.00 Using a=.05, we would reject the null hypothesis. D. Repeat the hypothesis test using the critical value approach. 582 333 759 633 629 523 320 685 599 753 553 641 290 800 696 627 679 667 542 619 950 614 548 570 678 697 750 569…arrow_forwardOften lottery winnings are divided into equal payments given annually for 20 – 25 years. So the present value of the winnings is worth less than the actual jackpot, depending on the rate at which money could be invested. Find the present value in dollars using the given conditions. Complete the table for each amount, interest rate, and number of payments. Jackpot Amount Interest Rate Equal Annual Payments Present Value (in dollars) $7,000,000 8% 20 $7,000,000 14% 20 $4 $7,000,000 8% 25 $ $7,000,000 14% 25 (Round to the nearest dollar as needed.)arrow_forwardThe annual revenue of Amazon is given in the table below (sourceLinks to an external site.). Year Amazon Annual Revenue(Billions of US dollars) 2020 386.064 2019 280.522 2018 232.887 2017 177.866 2016 135.987 2015 107.006 2014 88.988 2013 74.452 2012 61.093 2011 48.077 2010 34.204 In what year will the estimated revenue of Amazon be 1,357 billion US dollars? Note: I am asking for the year, not the number of years since 2010. This may happen between two years. Round to the nearest year.arrow_forward
 Algebra and Trigonometry (6th Edition)AlgebraISBN:9780134463216Author:Robert F. BlitzerPublisher:PEARSON
 Contemporary Abstract AlgebraAlgebraISBN:9781305657960Author:Joseph GallianPublisher:Cengage Learning
 Linear Algebra: A Modern IntroductionAlgebraISBN:9781285463247Author:David PoolePublisher:Cengage Learning
 Algebra And Trigonometry (11th Edition)AlgebraISBN:9780135163078Author:Michael SullivanPublisher:PEARSON
 Introduction to Linear Algebra, Fifth EditionAlgebraISBN:9780980232776Author:Gilbert StrangPublisher:Wellesley-Cambridge Press
 College Algebra (Collegiate Math)AlgebraISBN:9780077836344Author:Julie Miller, Donna GerkenPublisher:McGraw-Hill Education