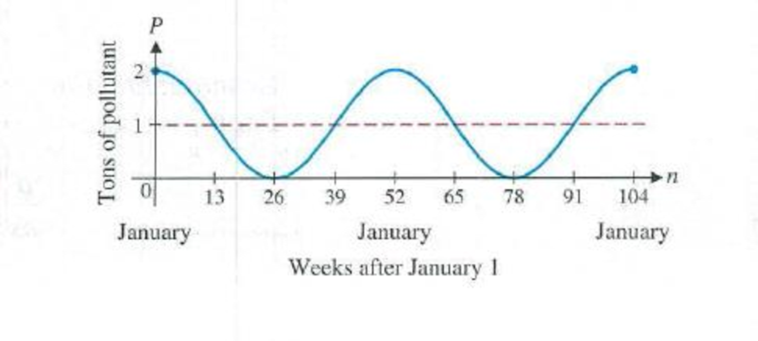
Pollution. In a large city, the amount of sulfur dioxide pollutant released into the atmosphere due to the burning of coal and oil for heating purposes varies seasonally. Suppose that the number of tons of pollutant released into the atmosphere during the n th week after January 1 is given approximately by P ( n ) = 1 + cos π n 26 0 ≤ n ≤ 104 The graph of the pollution function is shown in the figure. (A) Find the exact values of P (0), P (39), P (52), and P (65) without using a calculator. (B) Use a calculator to find P (10) and P (95). Interpret the results. (C) Use a graphing calculator to confirm the graph shown here for y = P ( n ).
Pollution. In a large city, the amount of sulfur dioxide pollutant released into the atmosphere due to the burning of coal and oil for heating purposes varies seasonally. Suppose that the number of tons of pollutant released into the atmosphere during the n th week after January 1 is given approximately by P ( n ) = 1 + cos π n 26 0 ≤ n ≤ 104 The graph of the pollution function is shown in the figure. (A) Find the exact values of P (0), P (39), P (52), and P (65) without using a calculator. (B) Use a calculator to find P (10) and P (95). Interpret the results. (C) Use a graphing calculator to confirm the graph shown here for y = P ( n ).
Solution Summary: The author calculates the exact values of P(0),P (39 )andp n65 (in tons) without the help of a calculator.
Pollution. In a large city, the amount of sulfur dioxide pollutant released into the atmosphere due to the burning of coal and oil for heating purposes varies seasonally. Suppose that the number of tons of pollutant released into the atmosphere during the nth week after January 1 is given approximately by
P
(
n
)
=
1
+
cos
π
n
26
0
≤
n
≤
104
The graph of the pollution function is shown in the figure.
(A) Find the exact values of P(0), P(39), P(52), and P(65) without using a calculator.
(B) Use a calculator to find P(10) and P(95). Interpret the results.
(C) Use a graphing calculator to confirm the graph shown here for y = P(n).
Need a deep-dive on the concept behind this application? Look no further. Learn more about this topic, subject and related others by exploring similar questions and additional content below.
Hypothesis Testing using Confidence Interval Approach; Author: BUM2413 Applied Statistics UMP;https://www.youtube.com/watch?v=Hq1l3e9pLyY;License: Standard YouTube License, CC-BY
Hypothesis Testing - Difference of Two Means - Student's -Distribution & Normal Distribution; Author: The Organic Chemistry Tutor;https://www.youtube.com/watch?v=UcZwyzwWU7o;License: Standard Youtube License


 Algebra & Trigonometry with Analytic GeometryAlgebraISBN:9781133382119Author:SwokowskiPublisher:Cengage