
Concept explainers
Videos
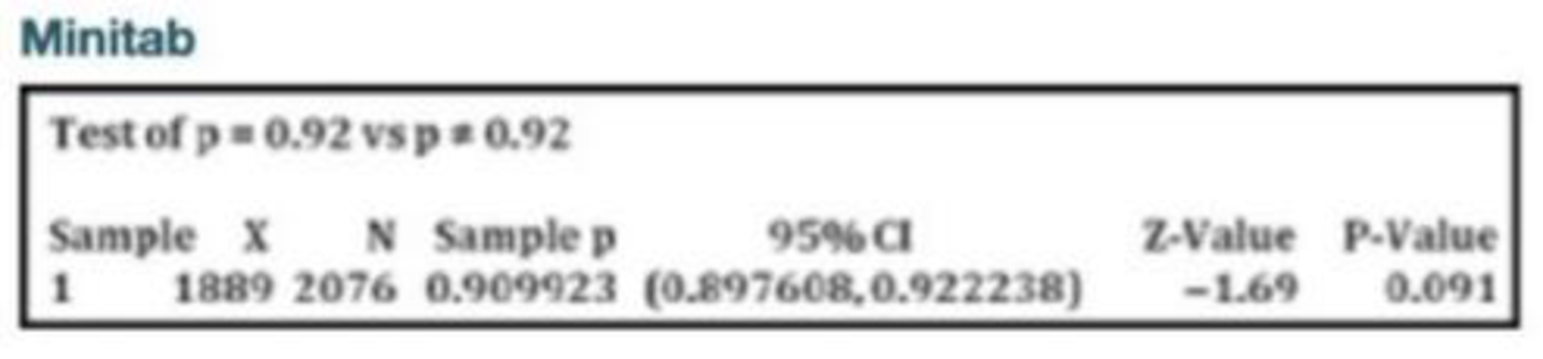
Using Technology. In Exercises 5–8, identify the indicated values or interpret the given display. Use the normal distribution as an approximation to the binomial distribution, as described in Part 1 of this section. Use a 0.05 significance level and answer the following:
a. Is the test two-tailed, left-tailed, or right-tailed?
b. What is the test statistic?
c. What is the P-value?
d. What is the null hypothesis, and what do you conclude about it?
e. What is the final conclusion?
7. Cell Phone Ownership A Pew Research Center poll of 2076 randomly selected adults showed that 91% of them own cell phones. The following Minitab display results from a test of the claim that 92% of adults own cell phones.

Learn your wayIncludes step-by-step video

Chapter 8 Solutions
MyLab Statistics with Pearson eText -- Standalone Access Card -- for Elementary Statistics
Additional Math Textbook Solutions
STATS:DATA+MODELS-W/DVD
Introductory Statistics (2nd Edition)
Statistics for Psychology
Intro Stats, Books a la Carte Edition (5th Edition)
An Introduction to Mathematical Statistics and Its Applications (6th Edition)


 Glencoe Algebra 1, Student Edition, 9780079039897...AlgebraISBN:9780079039897Author:CarterPublisher:McGraw Hill