
Path To College Mathematics, Books A La Carte Edition Plus Mylab Math Student Access Kit
1st Edition
ISBN: 9780134618555
Author: Elayn Martin-Gay
Publisher: PEARSON
expand_more
expand_more
format_list_bulleted
Concept explainers
Videos
Question
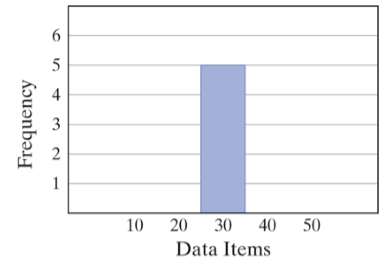
Chapter 8.3, Problem 73ES
To determine
To find the mean of data items from the given graph.
Expert Solution & Answer
Want to see the full answer?
Check out a sample textbook solution
Students have asked these similar questions
Help
Use the birth weights (grams) of 50 babies from the data set "Births." Use software or a calculator to find the mean and median. Examine the list of birth weights to make an observation about those numbers. How does that
observation affect the way that the results should be rounded?
Click the icon to view the birth weight data.
- X
The mean birth weight is
Birth weights (grams)
grams.
(Round to one decimal place as needed.)
300
4900
4000
3600
3400
3000
3700
2900
3700
3100
3400
3500
4100
3200
2900
2800
3500
3100
3300
3800
3800
2300
3300
2600
2400
3400
3300
4000
2800
3600
3100
2800
2800
2500
2600
2700
2600
3000
2900
3600
300
3400
3500
3400
3600
3400
3200
2600
3600
3500
Sara works for a hair salon and receives tips from her customers. The weekly tips(in AED) she received for 7 weeks are
200, 150, 100, 75, 60, 70, and 100.
Find the mean.
(Round your answer two decimal places.)
Find the median.
Find the range.
Find the mode.
Chapter 8 Solutions
Path To College Mathematics, Books A La Carte Edition Plus Mylab Math Student Access Kit
Ch. 8.1 - Prob. 1ESCh. 8.1 - Prob. 2ESCh. 8.1 - For each set of numbers, find the mean, median,...Ch. 8.1 - Prob. 4ESCh. 8.1 - Prob. 5ESCh. 8.1 - Prob. 6ESCh. 8.1 - Prob. 7ESCh. 8.1 - For each set of numbers, find the mean, median,...Ch. 8.1 - Prob. 9ESCh. 8.1 - Prob. 10ES
Ch. 8.1 - Prob. 11ESCh. 8.1 - Prob. 12ESCh. 8.1 - Prob. 13ESCh. 8.1 - The ten tallest buildings in the world, completed...Ch. 8.1 - Prob. 15ESCh. 8.1 - Prob. 16ESCh. 8.1 - Prob. 17ESCh. 8.1 - Prob. 18ESCh. 8.1 - Prob. 19ESCh. 8.1 - During an experiment, the following times (in...Ch. 8.1 - Prob. 21ESCh. 8.1 - Prob. 22ESCh. 8.1 - Prob. 23ESCh. 8.1 - Prob. 24ESCh. 8.1 - Prob. 25ESCh. 8.1 - Prob. 26ESCh. 8.1 - Prob. 27ESCh. 8.1 - Prob. 28ESCh. 8.1 - Prob. 29ESCh. 8.1 - Prob. 30ESCh. 8.1 - Below are lengths for the six longest rivers in...Ch. 8.1 - Prob. 32ESCh. 8.1 - Prob. 33ESCh. 8.1 - Prob. 34ESCh. 8.1 - Prob. 35ESCh. 8.1 - Prob. 36ESCh. 8.1 - Prob. 37ESCh. 8.1 - Prob. 38ESCh. 8.1 - Prob. 39ESCh. 8.1 - Prob. 40ESCh. 8.1 - Prob. 41ESCh. 8.1 - Prob. 42ESCh. 8.1 - Prob. 43ESCh. 8.1 - Prob. 44ESCh. 8.1 - Prob. 45ESCh. 8.1 - Prob. 46ESCh. 8.1 - Prob. 47ESCh. 8.1 - Prob. 48ESCh. 8.1 - Prob. 49ESCh. 8.1 - Prob. 50ESCh. 8.1 - Prob. 51ESCh. 8.1 - Prob. 52ESCh. 8.1 - Prob. 53ESCh. 8.1 - Prob. 54ESCh. 8.1 - Prob. 55ESCh. 8.1 - Prob. 56ESCh. 8.1 - Prob. 57ESCh. 8.1 - Prob. 58ESCh. 8.1 - Prob. 59ESCh. 8.1 - Prob. 60ESCh. 8.1 - Prob. 61ESCh. 8.1 - Prob. 62ESCh. 8.2 - Prob. 1ESCh. 8.2 - Prob. 2ESCh. 8.2 - Find the range for each data set. See Example 1....Ch. 8.2 - Prob. 4ESCh. 8.2 - Prob. 5ESCh. 8.2 - Prob. 6ESCh. 8.2 - Prob. 7ESCh. 8.2 - Prob. 8ESCh. 8.2 - Prob. 9ESCh. 8.2 - Prob. 10ESCh. 8.2 - Prob. 11ESCh. 8.2 - Prob. 12ESCh. 8.2 - Prob. 13ESCh. 8.2 - Prob. 14ESCh. 8.2 - Prob. 15ESCh. 8.2 - Prob. 16ESCh. 8.2 - Prob. 17ESCh. 8.2 - Prob. 18ESCh. 8.2 - Prob. 19ESCh. 8.2 - Prob. 20ESCh. 8.2 - Prob. 21ESCh. 8.2 - Prob. 22ESCh. 8.2 - Prob. 23ESCh. 8.2 - Prob. 24ESCh. 8.2 - Prob. 25ESCh. 8.2 - Prob. 26ESCh. 8.2 - Prob. 27ESCh. 8.2 - Prob. 28ESCh. 8.2 - Prob. 29ESCh. 8.2 - Prob. 30ESCh. 8.2 - Prob. 31ESCh. 8.2 - Prob. 32ESCh. 8.2 - Prob. 33ESCh. 8.2 - Prob. 34ESCh. 8.2 - Prob. 35ESCh. 8.2 - Prob. 36ESCh. 8.2 - Prob. 37ESCh. 8.2 - Prob. 38ESCh. 8.2 - Prob. 39ESCh. 8.2 - Prob. 40ESCh. 8.2 - Prob. 41ESCh. 8.2 - Prob. 42ESCh. 8.3 - Prob. 1ESCh. 8.3 - Prob. 2ESCh. 8.3 - Prob. 3ESCh. 8.3 - Prob. 4ESCh. 8.3 - Prob. 5ESCh. 8.3 - Prob. 6ESCh. 8.3 - Prob. 7ESCh. 8.3 - Prob. 8ESCh. 8.3 - Prob. 9ESCh. 8.3 - Prob. 10ESCh. 8.3 - Prob. 11ESCh. 8.3 - Prob. 12ESCh. 8.3 - Prob. 13ESCh. 8.3 - Prob. 14ESCh. 8.3 - Prob. 15ESCh. 8.3 - Prob. 16ESCh. 8.3 - Prob. 17ESCh. 8.3 - Prob. 18ESCh. 8.3 - Prob. 19ESCh. 8.3 - Prob. 20ESCh. 8.3 - Prob. 21ESCh. 8.3 - Prob. 22ESCh. 8.3 - Prob. 23ESCh. 8.3 - Prob. 24ESCh. 8.3 - Prob. 25ESCh. 8.3 - Prob. 26ESCh. 8.3 - Prob. 27ESCh. 8.3 - Prob. 28ESCh. 8.3 - Prob. 29ESCh. 8.3 - Prob. 30ESCh. 8.3 - Prob. 31ESCh. 8.3 - Prob. 32ESCh. 8.3 - Prob. 33ESCh. 8.3 - Prob. 34ESCh. 8.3 - Prob. 35ESCh. 8.3 - Prob. 36ESCh. 8.3 - Prob. 37ESCh. 8.3 - Prob. 38ESCh. 8.3 - Prob. 39ESCh. 8.3 - Prob. 40ESCh. 8.3 - Prob. 41ESCh. 8.3 - Prob. 42ESCh. 8.3 - Prob. 43ESCh. 8.3 - Prob. 44ESCh. 8.3 - Prob. 45ESCh. 8.3 - Prob. 46ESCh. 8.3 - Prob. 47ESCh. 8.3 - Prob. 48ESCh. 8.3 - Prob. 49ESCh. 8.3 - Prob. 50ESCh. 8.3 - Prob. 51ESCh. 8.3 - Prob. 52ESCh. 8.3 - Prob. 53ESCh. 8.3 - Prob. 54ESCh. 8.3 - Prob. 55ESCh. 8.3 - Prob. 56ESCh. 8.3 - Prob. 57ESCh. 8.3 - Prob. 58ESCh. 8.3 - Prob. 59ESCh. 8.3 - Prob. 60ESCh. 8.3 - Prob. 61ESCh. 8.3 - Prob. 62ESCh. 8.3 - Prob. 63ESCh. 8.3 - Prob. 64ESCh. 8.3 - Prob. 65ESCh. 8.3 - Prob. 66ESCh. 8.3 - Prob. 67ESCh. 8.3 - Prob. 68ESCh. 8.3 - Prob. 69ESCh. 8.3 - Prob. 70ESCh. 8.3 - Prob. 71ESCh. 8.3 - Prob. 72ESCh. 8.3 - Prob. 73ESCh. 8.3 - Prob. 74ESCh. 8.3 - Prob. 75ESCh. 8.3 - Prob. 76ESCh. 8.3 - Prob. 77ESCh. 8.3 - Prob. 78ESCh. 8.3 - Prob. 79ESCh. 8 - Prob. 1VCCh. 8 - Prob. 2VCCh. 8 - Prob. 3VCCh. 8 - Prob. 4VCCh. 8 - Prob. 5VCCh. 8 - Prob. 6VCCh. 8 - Prob. 7VCCh. 8 - Prob. 8VCCh. 8 - Prob. 9VCCh. 8 - Prob. 10VCCh. 8 - Prob. 11VCCh. 8 - Prob. 12VCCh. 8 - Prob. 13VCCh. 8 - Prob. 14VCCh. 8 - Prob. 15VCCh. 8 - Prob. 16VCCh. 8 - Prob. 1RCh. 8 - Prob. 2RCh. 8 - Prob. 3RCh. 8 - Prob. 4RCh. 8 - Prob. 5RCh. 8 - Prob. 6RCh. 8 - Prob. 7RCh. 8 - Prob. 8RCh. 8 - Prob. 9RCh. 8 - Prob. 10RCh. 8 - Prob. 11RCh. 8 - Prob. 12RCh. 8 - Prob. 13RCh. 8 - Prob. 14RCh. 8 - Prob. 15RCh. 8 - Prob. 16RCh. 8 - Prob. 17RCh. 8 - Prob. 18RCh. 8 - Prob. 19RCh. 8 - Prob. 20RCh. 8 - Prob. 21RCh. 8 - Prob. 22RCh. 8 - Prob. 23RCh. 8 - Prob. 24RCh. 8 - Prob. 25RCh. 8 - Prob. 26RCh. 8 - Prob. 27RCh. 8 - Prob. 28RCh. 8 - Prob. 29RCh. 8 - Prob. 30RCh. 8 - Prob. 31RCh. 8 - Prob. 32RCh. 8 - Prob. 33RCh. 8 - Prob. 34RCh. 8 - Prob. 35RCh. 8 - Prob. 36RCh. 8 - Prob. 37RCh. 8 - Prob. 38RCh. 8 - Prob. 39RCh. 8 - Prob. 40RCh. 8 - Prob. 41RCh. 8 - Prob. 42RCh. 8 - Prob. 43RCh. 8 - Prob. 44RCh. 8 - Prob. 1GRFTCh. 8 - Prob. 2GRFTCh. 8 - Prob. 3GRFTCh. 8 - Prob. 4GRFTCh. 8 - Prob. 5GRFTCh. 8 - Prob. 6GRFTCh. 8 - Prob. 7GRFTCh. 8 - Prob. 8GRFTCh. 8 - Prob. 9GRFTCh. 8 - Prob. 10GRFTCh. 8 - Prob. 11GRFTCh. 8 - Prob. 12GRFTCh. 8 - Prob. 1TCh. 8 - Prob. 2TCh. 8 - Prob. 3TCh. 8 - Prob. 4TCh. 8 - Prob. 5TCh. 8 - Prob. 6TCh. 8 - Prob. 7TCh. 8 - Prob. 8TCh. 8 - Prob. 9TCh. 8 - Prob. 10TCh. 8 - Prob. 11TCh. 8 - Prob. 12TCh. 8 - Prob. 13TCh. 8 - Prob. 14TCh. 8 - Prob. 15TCh. 8 - Prob. 16TCh. 8 - Prob. 17TCh. 8 - Prob. 18TCh. 8 - Prob. 19TCh. 8 - Prob. 1CRCh. 8 - Prob. 2CRCh. 8 - Prob. 3CRCh. 8 - Prob. 4CRCh. 8 - Prob. 5CRCh. 8 - Prob. 6CRCh. 8 - Prob. 7CRCh. 8 - Prob. 8CRCh. 8 - Prob. 9CRCh. 8 - Prob. 10CRCh. 8 - Prob. 11CRCh. 8 - Prob. 12CRCh. 8 - Prob. 13CRCh. 8 - Prob. 14CRCh. 8 - Prob. 15CRCh. 8 - Prob. 16CRCh. 8 - Prob. 17CRCh. 8 - Prob. 18CRCh. 8 - Prob. 19CRCh. 8 - Prob. 20CRCh. 8 - Solve: (5x1)(2x2+15x+18)=0.Ch. 8 - Prob. 22CRCh. 8 - Prob. 23CRCh. 8 - Prob. 24CRCh. 8 - Prob. 25CRCh. 8 - Prob. 26CRCh. 8 - Prob. 27CRCh. 8 - Prob. 28CRCh. 8 - Prob. 29CRCh. 8 - Prob. 30CRCh. 8 - Prob. 31CRCh. 8 - Prob. 32CRCh. 8 - Prob. 33CRCh. 8 - Prob. 34CRCh. 8 - Prob. 35CRCh. 8 - Prob. 36CRCh. 8 - Prob. 37CRCh. 8 - Prob. 38CRCh. 8 - Prob. 39CRCh. 8 - Prob. 40CRCh. 8 - Prob. 41CRCh. 8 - Prob. 42CRCh. 8 - Prob. 43CRCh. 8 - Prob. 44CR
Knowledge Booster


Learn more about
Need a deep-dive on the concept behind this application? Look no further. Learn more about this topic, subject and related others by exploring similar questions and additional content below.Similar questions
- Explain the difference between a positive and anegative correlation coefficient.arrow_forwardExplain how to interpret the absolute value of acorrelation coefficient.arrow_forwardUse the model we created using technology in Example 6 to predict the gas consumption in 2011. Is this aninterpolation or an extrapolation?arrow_forward
- Use this data for the exercises that follow: In 2013, there were roughly 317 million citizens in the United States, and about 40 million were elderly (aged 65 and over).[34] 56. If you meet a U.S. citizen, what is the percent chance that the person is elderly? (Round to the nearest tenth of a percent.)arrow_forwardThis bar graph shows the number of students who scored 1, 2, 3 or 4 in a certain quiz in a class. Find the mean and median of the class’s scores on this quiz. Round to two decimal places when needed. The mean score was and the median score wasarrow_forwardi need the outliers for this data thank u In 1961 Roger Maris broke Ruth’s record with 61 home runs. Here are Maris’s homerun numbers for the 10 years he was in the American League. 13 23 26 16 33 61 28 39 14 8arrow_forward
- Use the data in the following table, which lists carbon dioxide concentrations (in parts per million) for each year from 1960 to 2009, with projected values used for the last four years. After finding the values of the mean and range for each decade, find the values of x,and R. Also find the values of LCL and UCL for an R chart, and find the values of LCL and UCL for an x chart. Atmospheric Carbon Dioxide Concentrations (in parts per million) 1960s 313.3 315.1 315.8 317.2 319.4 320.4 321.9 323.2 324.8 326.4 1970s 327.9 329.7 331.5 333.1 334.8 335.3 337.1 337.9 340.5 341.6 1980s 342.8 344.8 345.8 347.1 349.1 350.6 352.1 352.8 355.4 355.8 1990s 357.5 358.9 360.7 361.9 363.9 365.3 366.4 367.8 369.6 370.5 2000s 372.2 374.7 376.2 376.6 377.8 379.5 381.1 382.7 384.6 385.8 x=enter your response here (Round to three decimal places as needed.)…arrow_forwardUse the data in the following table, which lists carbon dioxide concentrations (in parts per million) for each year from 1960 to 2009, with projected values used for the last four years. After finding the values of the mean and range for each decade, find the values of x, and R. Also find the values of LCL and UCL for an R chart, and find the values of LCL and UCL for an x chart. 1960s 318.4 319.5 321.8 322.9 324.8 325.4 326.9 328.5 330.3 331.4 1970s 333.4 334.6 335.5 337.1 339.3 340.4 341.4 343.1 344.7 346.5 1980s 348.1 348.8 351.2 352.1 353.8 355.4 356.9 358.5 359.8 360.6 1990s 361.9 363.6 365.8 366.7 368.6 369.2 371.7 372.4 373.5 375.2 2000s 377.6 378.7 379.6 381.8 382.8 384.2 386.3 387.6 388.7 390.5 x=enter your response here (Round to three decimal places as needed.) Part 2 R=enter your response here (Round to two decimal places as needed.) Compute the values of LCL and UCL for an R chart. LCL=enter your response here, UCL=enter your response here (Round to…arrow_forwardUse the dotplots to find the mean, median, and IQR of quiz grades for each class. Round to 1 decimal place, if needed. Attach your supporting work at the end of this quiz. Quiz Grades for Class A 10 Quiz Grades for Class B mean median IQR Class A Class B 00000 000000 000arrow_forward
- The students in a class collected data on the number of minutes some of them spend brushing their teeth every day. That data is shown in the dot plot below. BRUSHING TEETHBRUSHING TEETH 0.511.522.533.544.5 Time Brushing (minutes) What was the shortest time someone spent brushing their teeth? minutesarrow_forwardin image, tyarrow_forwardConsider the woman's 100 Your - and the subsequent 100 meter - in the Olympics since records have been kept determined the best way to combine all the data in depict the data would you use a histogram A-line graph a stem and leaf plot or a scatterplotarrow_forward
arrow_back_ios
SEE MORE QUESTIONS
arrow_forward_ios
Recommended textbooks for you
 Big Ideas Math A Bridge To Success Algebra 1: Stu...AlgebraISBN:9781680331141Author:HOUGHTON MIFFLIN HARCOURTPublisher:Houghton Mifflin Harcourt
 Glencoe Algebra 1, Student Edition, 9780079039897...AlgebraISBN:9780079039897Author:CarterPublisher:McGraw Hill
 Holt Mcdougal Larson Pre-algebra: Student Edition...AlgebraISBN:9780547587776Author:HOLT MCDOUGALPublisher:HOLT MCDOUGAL
 Algebra: Structure And Method, Book 1AlgebraISBN:9780395977224Author:Richard G. Brown, Mary P. Dolciani, Robert H. Sorgenfrey, William L. ColePublisher:McDougal Littell
Big Ideas Math A Bridge To Success Algebra 1: Stu...
Algebra
ISBN:9781680331141
Author:HOUGHTON MIFFLIN HARCOURT
Publisher:Houghton Mifflin Harcourt
Glencoe Algebra 1, Student Edition, 9780079039897...
Algebra
ISBN:9780079039897
Author:Carter
Publisher:McGraw Hill
Holt Mcdougal Larson Pre-algebra: Student Edition...
Algebra
ISBN:9780547587776
Author:HOLT MCDOUGAL
Publisher:HOLT MCDOUGAL
Algebra: Structure And Method, Book 1
Algebra
ISBN:9780395977224
Author:Richard G. Brown, Mary P. Dolciani, Robert H. Sorgenfrey, William L. Cole
Publisher:McDougal Littell
The Shape of Data: Distributions: Crash Course Statistics #7; Author: CrashCourse;https://www.youtube.com/watch?v=bPFNxD3Yg6U;License: Standard YouTube License, CC-BY
Shape, Center, and Spread - Module 20.2 (Part 1); Author: Mrmathblog;https://www.youtube.com/watch?v=COaid7O_Gag;License: Standard YouTube License, CC-BY
Shape, Center and Spread; Author: Emily Murdock;https://www.youtube.com/watch?v=_YyW0DSCzpM;License: Standard Youtube License