Bundle: Understandable Statistics: Concepts And Methods, 12th + Webassign, Single-term Printed Access Card
12th Edition
ISBN: 9781337605199
Author: Charles Henry Brase, Corrinne Pellillo Brase
Publisher: Brooks Cole
bartleby

Concept explainers

bartleby

Videos

Question
Book Icon
Chapter 8.5, Problem 13P

(a)

To determine

Find the pooled probability of success for the two experiments.

(a)

Expert Solution
Check Mark

Answer to Problem 13P

The pooled probability of success for the two experiments is 0.657.

Explanation of Solution

Calculation:

The pooled best estimate for the population probabilities of success is,

p¯=r1+r2n1+n2

Where, r1 is the successes out of n1 trials for the first population, and r2 is the successes out of n2 trials for the second population.

Substitute r1 as 45, r2 as 70, n1 as 75, and n2 as 100 in the estimate formula

p¯=45+7075+100=112175=0.657

Hence, the pooled probability of success for the two experiments is 0.657.

(b)

To determine

Identify the distribution of the sample test statistic.

(b)

Expert Solution
Check Mark

Answer to Problem 13P

The distribution of the sample test statistic normal distribution.

Explanation of Solution

Calculation:

Conditions:

Consider binomial experiment 1 with n1 number of trails, r1 number of success, probability of success for each trail p1 and probability of failure q1=1p1. And binomial experiment 2 with n2 number of trails, r2 number of success, probability of success for each trail p2 and probability of failure q2=1p2.

Also, p^1=r1n1 is the sample proportion of first sample where r1 is the successes out of n1 trials for the first population and p^2=r2n2 is the sample proportion of second sample where r2 is the successes out of n2 trials for the second population.

For sufficiently larger number of trails the following four conditions must be satisfied to use sample test statistic p^1p^2 with z value are,

  • n1p¯>5
  • n1q¯>5
  • n2p¯>5
  • n2q¯>5

Where, p¯=r1+r2n1+n2 is the pooled estimate of proportion, with total number of successes (r1+r2) and total number of trials (n1+n2).

q¯=1p¯ is the pooled estimate of proportion of failure.

Checking conditions:

n1p¯=75(0.657)=49.275>5

n2p¯=100(0.657)=65.7>5

n1q¯=n1(1p¯)=75(10.657)=75(0.343)=25.725>5

n2q¯=n2(1p¯)=100(10.657)=100(0.343)=34.3>5

It can be observed that two of the conditions n1p¯>5, n2p¯>5, n1q¯>5, n1q¯>5 are satisfied. It is appropriate to use normal distribution.

Hence, distribution of the sample test statistic normal distribution.

(c)

To determine

State the hypotheses.

(c)

Expert Solution
Check Mark

Answer to Problem 13P

The hypotheses is,

Null hypothesis: H0:p1=p2.

Alternative hypothesis: H1:p1p2.

Explanation of Solution

Calculation:

Let p1 denotes the probability of success of the first sample, p2 denotes the probability of success of the first sample.

From the given information the value of α is 0.05, and the claim that the probabilities of success for the two binomial experiments differ.

The null and alternative hypothesis is,

Null hypothesis:

H0:p1=p2

Alternative hypothesis:

H1:p1p2

(d)

To determine

Find the value of p^1p^2.

Find the sample distribution value of p^1p^2.

(d)

Expert Solution
Check Mark

Answer to Problem 13P

The value of p^1p^2 is –0.1.

The sample distribution value of p^1p^2 is –1.38.

Explanation of Solution

Calculation:

The two sample z statistic for proportion is,

z=p^1p^2p¯q¯n1+p¯q¯n1

In the formula,

p^1=r1n1 is the sample proportion of first sample where r1 is the successes out of n1 trials for the first population.

p^2=r2n2 is the sample proportion of first sample where r2 is the successes out of n2 trials for the first population.

p¯=r1+r2n1+n2 is the pooled estimate of proportion, with total number of successes (r1+r2) and total number of trials (n1+n2).

q¯=1p¯ is the pooled estimate of proportion of failure.

The value of p^1p^2 is,

p^1p^2=457570100=0.60.7=0.1

Hence, the value of p^1p^2 is –0.1.

Z-statistic:

Substitute p^1 as 0.6, p^2 as 0.7, p¯ as 0.657, q¯ as 0.343, n1 as 75, and n2 as 100 in the test statistic formula

z=0.60.70.657×0.34375+0.657×0.343100=0.10.0725=1.38

Hence, the sample distribution value of p^1p^2 is –1.38.

(e)

To determine

Find the P-value of the sample test statistic.

(e)

Expert Solution
Check Mark

Answer to Problem 13P

The P-value of the sample test statistic is 0.1676.

Explanation of Solution

Calculation:

Step by step procedure to obtain P-value using MINITAB software is given below:

  • Choose Graph > Probability Distribution Plot choose View Probability > OK.
  • From Distribution, choose ‘Normal’ distribution.
  • Click the Shaded Area tab.
  • Choose X Value and Both Tails, for the region of the curve to shade.
  • Enter the X value as –1.38.
  • Click OK.

Output using MINITAB software is given below:

Bundle: Understandable Statistics: Concepts And Methods, 12th + Webassign, Single-term Printed Access Card, Chapter 8.5, Problem 13P

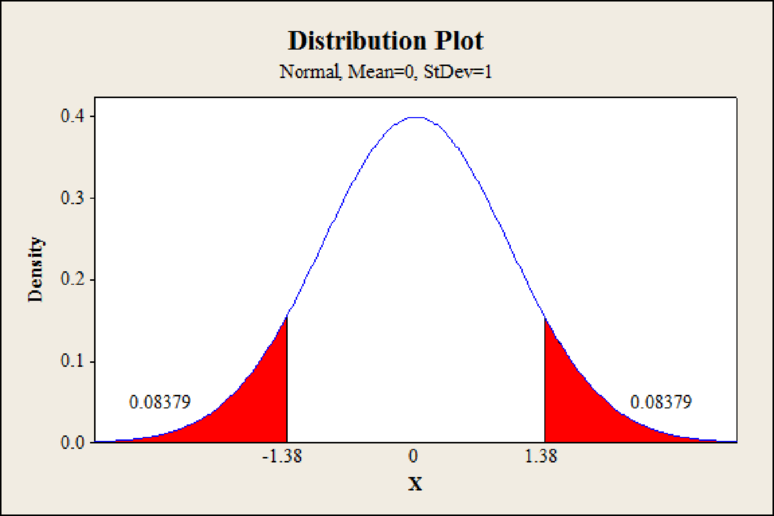
From Minitab output, the P-value is 0.0838 which is one sided value.

The P-value for the two-tailed value is,

P-value=2×0.0838=0.1676

Hence, the P-value of the sample test statistic is 0.1676.

(f)

To determine

Check whether the null hypothesis is rejecting or fail to reject.

(f)

Expert Solution
Check Mark

Answer to Problem 13P

The null hypothesis is failed to reject.

Explanation of Solution

Calculation:

From part (e), the P-value is 0.1676.

Rejection rule:

  • If the P-value is less than or equal to α, then reject the null hypothesis and the test is statistically significant. That is, P-valueα.

Conclusion:

The P-value is 0.1676 and the level of significance is 0.05.

The P-value is greater than the level of significance.

That is, 0.1676(=P-value)>0.05(=α).

By the rejection rule, the null hypothesis is not rejected.

Hence, the data is not statistically significant at level 0.05.

(g)

To determine

Interpret the results.

(g)

Expert Solution
Check Mark

Explanation of Solution

Calculation:

From part (f), the null hypothesis is not rejected. This shows that, there is no sufficient evidence to conclude the probabilities of success for the two binomial experiments differ at 0.05 level of significance.

Want to see more full solutions like this?

Subscribe now to access step-by-step solutions to millions of textbook problems written by subject matter experts!

Chapter 8 Solutions

Bundle: Understandable Statistics: Concepts And Methods, 12th + Webassign, Single-term Printed Access Card

Ch. 8.1 - Basic Computation: Setting Hypotheses Suppose you...Ch. 8.1 - Basic Computation: Setting Hypotheses Suppose you...Ch. 8.1 - Basic Computation: Find Test Statistic,...Ch. 8.1 - Basic Computation: Find the Test Statistic,...Ch. 8.1 - Veterinary Science: Colts The body weight of a...Ch. 8.1 - Marketing: Shopping Time How much customers buy is...Ch. 8.1 - Meteorology: Storms Weatherwise magazine is...Ch. 8.1 - Chrysler Concorde: Acceleration Consumer Reports...Ch. 8.1 - For Problems 1924, please provide the following...Ch. 8.1 - For Problems 1924, please provide the following...Ch. 8.1 - For Problems 1924, please provide the following...Ch. 8.1 - For Problems 1924, please provide the following...Ch. 8.1 - Prob. 23PCh. 8.1 - Prob. 24PCh. 8.2 - Statistical Literacy For the same sample data and...Ch. 8.2 - Statistical Literacy To test for an x...Ch. 8.2 - Statistical Literacy When using the Students t...Ch. 8.2 - Critical Thinking Consider a test for . If the...Ch. 8.2 - Critical Thinking Consider a test for . If the...Ch. 8.2 - Critical Thinking If sample data is such that for...Ch. 8.2 - Basic Computation: P-value Corresponding to t...Ch. 8.2 - Basic Computation: P-value Corresponding to t...Ch. 8.2 - Basic Computation: Testing , Unknown A random...Ch. 8.2 - Basic Computation: Testing , Unknown A random...Ch. 8.2 - Please provide the following information for...Ch. 8.2 - Please provide the following information for...Ch. 8.2 - Please provide the following information for...Ch. 8.2 - Please provide the following information for...Ch. 8.2 - Please provide the following information for...Ch. 8.2 - Prob. 16PCh. 8.2 - Please provide the following information for...Ch. 8.2 - Prob. 18PCh. 8.2 - Please provide the following information for...Ch. 8.2 - Prob. 20PCh. 8.2 - Prob. 21PCh. 8.2 - Prob. 22PCh. 8.2 - Critical Thinking: One-Tailed versus Two-Tailed...Ch. 8.2 - Prob. 25PCh. 8.2 - Prob. 26PCh. 8.2 - Prob. 27PCh. 8.2 - Prob. 28PCh. 8.2 - Prob. 29PCh. 8.2 - Prob. 30PCh. 8.3 - Statistical Literacy To use the normal...Ch. 8.3 - Statistical Literacy Consider a binomial...Ch. 8.3 - Prob. 3PCh. 8.3 - Critical Thinking An article in a newspaper states...Ch. 8.3 - Basic Computation: Testing p A random sample of 30...Ch. 8.3 - Basic Computation: Testing p A random sample of 60...Ch. 8.3 - Prob. 7PCh. 8.3 - Prob. 8PCh. 8.3 - Prob. 9PCh. 8.3 - For Problems 721, please provide the following...Ch. 8.3 - Prob. 11PCh. 8.3 - For Problems 721, please provide the following...Ch. 8.3 - For Problems 721, please provide the following...Ch. 8.3 - Prob. 14PCh. 8.3 - For Problems 721, please provide the following...Ch. 8.3 - Prob. 16PCh. 8.3 - For Problems 721, please provide the following...Ch. 8.3 - Prob. 18PCh. 8.3 - Prob. 19PCh. 8.3 - Prob. 20PCh. 8.3 - Prob. 21PCh. 8.3 - Prob. 22PCh. 8.3 - Critical Region Method: Testing Proportions Solve...Ch. 8.3 - Prob. 24PCh. 8.4 - Prob. 1PCh. 8.4 - Prob. 2PCh. 8.4 - Prob. 3PCh. 8.4 - Prob. 4PCh. 8.4 - Prob. 5PCh. 8.4 - Prob. 6PCh. 8.4 - Prob. 7PCh. 8.4 - Basic Computation: Paired Differences Test For a...Ch. 8.4 - Prob. 9PCh. 8.4 - Prob. 10PCh. 8.4 - For Problems 921 assume that the distribution of...Ch. 8.4 - For Problems 921 assume that the distribution of...Ch. 8.4 - Prob. 13PCh. 8.4 - Prob. 14PCh. 8.4 - Prob. 15PCh. 8.4 - Prob. 16PCh. 8.4 - For Problems 921 assume that the distribution of...Ch. 8.4 - Prob. 18PCh. 8.4 - Prob. 19PCh. 8.4 - Prob. 20PCh. 8.4 - Prob. 21PCh. 8.4 - Expand Your Knowledge: Confidence Intervals for d...Ch. 8.4 - Prob. 23PCh. 8.4 - Prob. 24PCh. 8.5 - Statistical Literacy Consider a hypothesis test of...Ch. 8.5 - Prob. 2PCh. 8.5 - Prob. 3PCh. 8.5 - Statistical Literacy Consider a hypothesis test of...Ch. 8.5 - Statistical Literacy Consider a hypothesis test of...Ch. 8.5 - Critical Thinking Consider use of a Students t...Ch. 8.5 - Critical Thinking When conducting a test for the...Ch. 8.5 - Critical Thinking When conducting a test for the...Ch. 8.5 - Basic Computation: Testing 1 2 A random sample of...Ch. 8.5 - Basic Computation: Testing 1 2 Two populations...Ch. 8.5 - Basic Computation: Testing 1 2 A random sample of...Ch. 8.5 - Basic Computation: Testing 1 2 Two populations...Ch. 8.5 - Prob. 13PCh. 8.5 - Prob. 14PCh. 8.5 - Please provide the following information for...Ch. 8.5 - Please provide the following information for...Ch. 8.5 - Please provide the following information for...Ch. 8.5 - Please provide the following information for...Ch. 8.5 - Please provide the following information for...Ch. 8.5 - Please provide the following information for...Ch. 8.5 - Prob. 21PCh. 8.5 - Please provide the following information for...Ch. 8.5 - Prob. 23PCh. 8.5 - Prob. 24PCh. 8.5 - Prob. 25PCh. 8.5 - Prob. 26PCh. 8.5 - Prob. 27PCh. 8.5 - Prob. 28PCh. 8.5 - Prob. 29PCh. 8.5 - Prob. 30PCh. 8.5 - Please provide the following information for...Ch. 8.5 - Prob. 32PCh. 8.5 - Prob. 33PCh. 8.5 - Prob. 34PCh. 8.5 - Prob. 35PCh. 8.5 - Prob. 36PCh. 8.5 - Prob. 37PCh. 8.5 - Prob. 38PCh. 8 - Prob. 1CRPCh. 8 - Prob. 2CRPCh. 8 - Critical Thinking All other conditions being...Ch. 8 - Prob. 4CRPCh. 8 - Before you solve each problem below, first...Ch. 8 - Prob. 6CRPCh. 8 - Prob. 7CRPCh. 8 - Prob. 8CRPCh. 8 - Prob. 9CRPCh. 8 - Prob. 10CRPCh. 8 - Prob. 11CRPCh. 8 - Prob. 12CRPCh. 8 - Prob. 13CRPCh. 8 - Prob. 14CRPCh. 8 - Before you solve each problem below, first...Ch. 8 - Prob. 16CRPCh. 8 - Prob. 17CRPCh. 8 - Prob. 18CRPCh. 8 - Discuss each of the following topics in class or...Ch. 8 - Prob. 2LCCh. 8 - Prob. 3LCCh. 8 - Prob. 4LCCh. 8 - Prob. 5LC
Knowledge Booster
Background pattern image
Statistics
Learn more about
Need a deep-dive on the concept behind this application? Look no further. Learn more about this topic, statistics and related others by exploring similar questions and additional content below.
Similar questions
Recommended textbooks for you
Text book image
Algebra and Trigonometry (MindTap Course List)
Algebra
ISBN:9781305071742
Author:James Stewart, Lothar Redlin, Saleem Watson
Publisher:Cengage Learning
Text book image
College Algebra
Algebra
ISBN:9781337282291
Author:Ron Larson
Publisher:Cengage Learning
Mod-01 Lec-01 Discrete probability distributions (Part 1); Author: nptelhrd;https://www.youtube.com/watch?v=6x1pL9Yov1k;License: Standard YouTube License, CC-BY
Discrete Probability Distributions; Author: Learn Something;https://www.youtube.com/watch?v=m9U4UelWLFs;License: Standard YouTube License, CC-BY
Probability Distribution Functions (PMF, PDF, CDF); Author: zedstatistics;https://www.youtube.com/watch?v=YXLVjCKVP7U;License: Standard YouTube License, CC-BY
Discrete Distributions: Binomial, Poisson and Hypergeometric | Statistics for Data Science; Author: Dr. Bharatendra Rai;https://www.youtube.com/watch?v=lHhyy4JMigg;License: Standard Youtube License