
Videos
Using Table G, find the critical value(s) for each. Show the critical and noncritical regions, and state the appropriate null and alternative hypotheses. Use σ2 = 225.
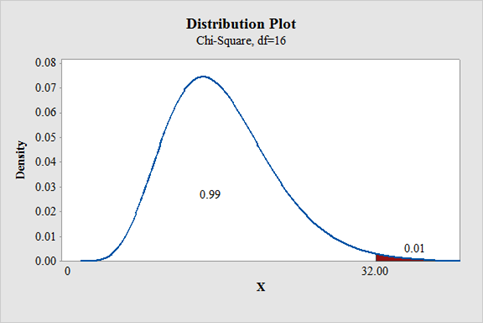
a. α = 0.01, n = 17, right-tailed
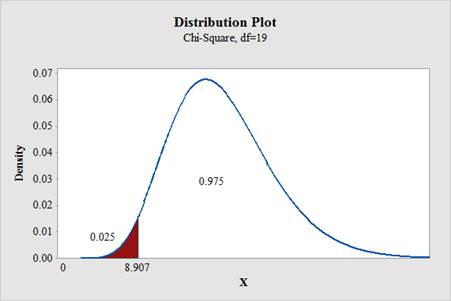
b. α = 0.025, n = 20, left-tailed
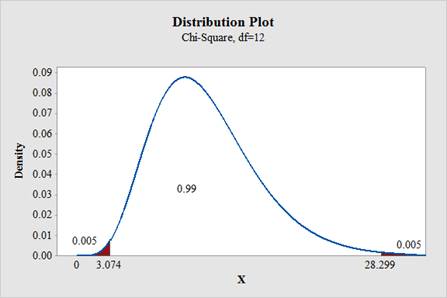
c. α = 0.01, n = 13, two-tailed
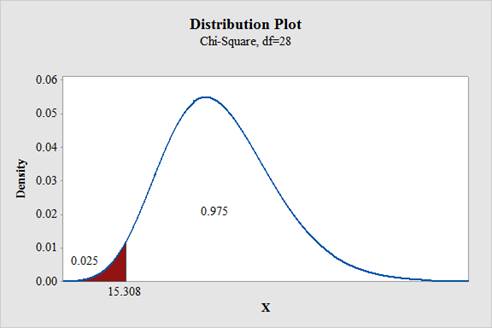
d. α = 0.025, n = 29, left-tailed
a.
To find: The critical value for right tailed test.
Answer to Problem 2E
The critical value for right tailed test is 32.000.
Null hypothesis:
Alternative hypothesis:
Explanation of Solution
The level of significance is
Answer:
Degrees of freedom:
From “Table G: The chi square distribution”, the critical values for the
Software Procedure:
Degrees of freedom:
From “Table G: The chi square distribution”, the critical values for the
Software Procedure:
Step-by-step procedure to obtain the critical region using the MINITAB software:
- Choose Graph > Probability Distribution Plot > choose View Probability> OK.
- From Distribution, choose Chi-square.
- In Degrees of freedom, enter 16.
- Click the Shaded Area tab.
- Choose Probability value and Right Tail for the region of the curve to shade.
- Enter the Probability value as 0.01.
- Click OK.
Output using the MINITAB software is given below:
State the null and alternative hypotheses:
Null hypothesis:
Alternative hypothesis:
b.
To find: The critical value for left tailed test.
Answer to Problem 2E
The critical value for left tailed test is 8.907.
Null hypothesis:
Alternative hypothesis:
Explanation of Solution
The level of significance is
Solution:
Degrees of freedom:
If the test is left tail, the level of significance is subtracted from 1. That is,
From “Table G: The chi square distribution”, the critical values for the
Software Procedure:
Step-by-step procedure to obtain the critical region using the MINITAB software:
- Choose Graph > Probability Distribution Plot > choose View Probability> OK.
- From Distribution, choose Chi-square.
- In Degrees of freedom, enter 19.
- Click the Shaded Area tab.
- Choose Probability value and Left Tail for the region of the curve to shade.
- Enter the Probability value as 0.025.
- Click OK.
Output using the MINITAB software is given below:
State the null and alternative hypotheses:
Null hypothesis:
Alternative hypothesis:
c.
To find: The critical values for two tailed test.
Answer to Problem 2E
The critical values for two tailed test is 3.074 and 28.299, respectively.
Null hypothesis:
Alternative hypothesis:
Explanation of Solution
Given info:
The level of significance is
Solution:
Degrees of freedom:
The area to the right of larger value is,
From “Table G: The chi square distribution”, the critical values for the
Software Procedure:
Step-by-step procedure to obtain the critical region using the MINITAB software:
- Choose Graph > Probability Distribution Plot > choose View Probability> OK.
- From Distribution, choose Chi-square.
- In Degrees of freedom, enter 12.
- Click the Shaded Area tab.
- Choose Probability value and Both Tail for the region of the curve to shade.
- Enter the Probability value as 0.01.
- Click OK.
Output using the MINITAB software is given below:
State the null and alternative hypotheses:
Null hypothesis:
Alternative hypothesis:
d.
To find: The critical value for left tailed test.
Answer to Problem 2E
The critical value for left tailed test is 15.308.
Null hypothesis:
Alternative hypothesis:
Explanation of Solution
Given info:
The level of significance is
Solution:
Degrees of freedom:
If the test is left tail, the level of significance is subtracted from 1. That is,
From “Table G: The chi square distribution”, the critical values for the
Software Procedure:
Step-by-step procedure to obtain the critical region using the MINITAB software:
- Choose Graph > Probability Distribution Plot > choose View Probability> OK.
- From Distribution, choose Chi-square.
- In Degrees of freedom, enter 28.
- Click the Shaded Area tab.
- Choose Probability value and Left Tail for the region of the curve to shade.
- Enter the Probability value as 0.025.
- Click OK.
Output using the MINITAB software is given below:
State the null and alternative hypotheses:
Null hypothesis:
Alternative hypothesis:
Want to see more full solutions like this?
Chapter 8 Solutions
ELEMENTARY STATISTICS W/CONNECT >IP<


- State the hypothesis and identify the claim. Find the critical and z-values.arrow_forwardif alpha is 1%, find the critical value (z-score)arrow_forwardHenry performed a two-tailed test for an experiment in which N = 24. He could not find his table of t critical values, but he remembered the tcv at df= 13. He decided to compare his tobt with this tcv. Is he more likely to make a Type I or a Type II error in this situation?arrow_forward
- Consider the null hypotheses for the following multinomial experiments. (Give your answers correct to two decimal places.) (a) Determine the critical value and critical region that would be used in the classical approach to test Ho: P(1) = P(2) = P(3) = P(4) = 0.25, with a = 0.1.x2 (b) Determine the critical value and critical region that would be used in the classical approach to test Ho: P(1) = 0.25, P(2) = 0.40, P(3) = 0.35, with a = 0.1.x2arrow_forwardFor 50 randomly selected speed dates, attractiveness ratings by males of their female date partners (x) are recorded along with the attractiveness ratings by females of their male date partners (y); the ratings range from 1 to 10. The 50 paired ratings yield x=6.3, y=5.9, r=−0.256, P-value=0.073, and y=7.73−0.285x. Find the best predicted value of y (attractiveness rating by female of male) for a date in which the attractiveness rating by the male of the female is x=6. Use a 0.01 significance level. The best predicted value of y when x=6 is?arrow_forwardA neighborhood of 45 homes found that 75% (SD=2.1) had at least one pet. The city-wide average for neighborhoods is 71%. Find the critical value of t and the value of t we obtain (or observe) presuming a 2-tailed test. Also, calculate the effect size. Lastly, write a statement of the hypotheses with your findings.arrow_forward
- You are performing a right-tailed test.If α=.001α=.001, find the critical value, to four decimal places.zα=? You are performing a two-tailed test.If α=.005α=.005, find the positive critical value, to four decimal places.zα/2= ?arrow_forwardL12Q5.At 10% level of significance, the critical value(s) of z to test H0: μ1= μ2; against Ha: μ1 ≠ μ2 is/arearrow_forwardYou are performing a two-tailed test.If α=.002α=.002, find the positive critical value, to three decimal places.zα/2arrow_forward
- For 50 randomly selected speed dates, attractiveness ratings by males of their female date partners (x) are recorded along with the attractiveness ratings by females of their male date partners (y); the ratings range from 1 to 10. The 50 paired ratings yield x=6.3, y=6.0, r=−0.264, P-value=0.063, and y=7.92−0.304x. Find the best predicted value of y (attractiveness rating by female of male) for a date in which the attractiveness rating by the male of the female is x=4. Use a 0.01 significance level. The best predicted value of y when x=4 is __ (Round to one decimal place as needed.)arrow_forwardFor 50 randomly selected speed dates, attractiveness ratings by males of their female date partners (x) are recorded along with the attractiveness ratings by females of their male date partners (y); the ratings range from 1 to 10. The 50 paired ratings yield x=6.3, y=6.0, r=−0.228, P-value=0.111, and y=7.81−0.280x. Find the best predicted value of y(attractiveness rating by female of male) for a date in which the attractiveness rating by the male of the female is x=5. Use a 0.10 significance level. The best predicted value of ywhen x=5 is nothing. (Round to one decimal place as needed.)arrow_forwardQ21 An environmental researcher claims that the mean fluoride content of tap water in UAE does not exceed the optimal value of 0.7 mg/L. The appropriate null and alternative hypotheses are H subscript 0 colon equals space 0.7 H subscript a colon not equal to 0.7 H subscript 0 colon less or equal than 0.7 H subscript a colon greater than 0.7 H subscript 0 colon greater or equal than 0.7 H subscript a colon less than 0.7 H subscript 0 colon X with bar on top space less or equal than space 0.7 H subscript a colon X with bar on top space greater than 0.7arrow_forward
 MATLAB: An Introduction with ApplicationsStatisticsISBN:9781119256830Author:Amos GilatPublisher:John Wiley & Sons Inc
 Probability and Statistics for Engineering and th...StatisticsISBN:9781305251809Author:Jay L. DevorePublisher:Cengage Learning
 Statistics for The Behavioral Sciences (MindTap C...StatisticsISBN:9781305504912Author:Frederick J Gravetter, Larry B. WallnauPublisher:Cengage Learning
 Elementary Statistics: Picturing the World (7th E...StatisticsISBN:9780134683416Author:Ron Larson, Betsy FarberPublisher:PEARSON
 The Basic Practice of StatisticsStatisticsISBN:9781319042578Author:David S. Moore, William I. Notz, Michael A. FlignerPublisher:W. H. Freeman
 Introduction to the Practice of StatisticsStatisticsISBN:9781319013387Author:David S. Moore, George P. McCabe, Bruce A. CraigPublisher:W. H. Freeman