
Concept explainers
Videos
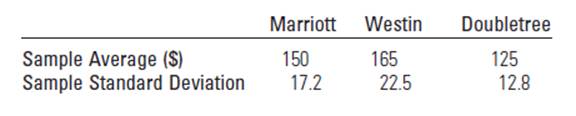
Hotel Costs Refer to Exercise 8.20. The means and standard deviations for 50 billing statements from each of the computer databases of each of the three hotel chains are given in the table
a. Find a 95% confidence interval for the difference in the average room rates for the Marriott and the Westin hotel chains.
b. Find a 99% confidence interval for the difference in the average room rates for the Westin and the Doubletree hotel chains.
c. Do the intervals in parts a and b contain the value  Why is this of interest to the researcher?
d. Do the data indicate a difference in the average room rates between the Marriott and the Westin chains? Between the Westin and the Doubletree chains?
(a)
To find: the 95% confidence interval for the difference between two population means.
Answer to Problem 8.51E
The confidence interval is
Explanation of Solution
Given:
The sample size of Region 1 (
The sample size of Region 2 (
The level of significance (
The sample mean of region 1 is 150.
The sample mean of region 2 is 165.
The sample variance of region 1 is 17.2.
The sample variance of region 2 is 22.5.
Formulae used:
Consider two sample sizes
Calculations:
Consider,
Also, Consider
The Z Critical value at 95% level of significance is 1.96 calculated from the standard normal table.
The
Therefore, the confidence interval for difference between two population means (
(b)
To find: the 99% confidence interval for the difference between two population means.
Answer to Problem 8.51E
The confidence interval is
Explanation of Solution
Given:
The sample size of Region 1 (
The sample size of Region 2 (
The level of significance (
The sample mean of region 1 is 165.
The sample mean of region 2 is 125.
The sample variance of region 1 is 22.5.
The sample variance of region 2 is 12.8.
Calculations:
The Z Critical value at 99% level of significance is 2.58 calculated from the standard normal table.
The
Therefore, the confidence interval for difference between two population means (
(c)
To check: if there exists difference between two population means or not..
Answer to Problem 8.51E
Yes, there is a difference between two means.
Explanation of Solution
The confidence interval for difference between two population means (
The confidence interval for difference between two population means (
Since, 0 is not contained in either of the intervals.
Therefore, there is a significant difference in both the population means.
(d)
To check: if there exists difference between two population means or not.
Answer to Problem 8.51E
Yes, there is a difference between two means.
Explanation of Solution
The confidence interval for difference between two population means (
The confidence interval for difference between two population means (
Since, 0 is not contained in either of the intervals.
Therefore, there is a significant difference in both the population means.
This shows that there does exist significant rates difference.
Want to see more full solutions like this?
Chapter 8 Solutions
EBK INTRODUCTION TO PROBABILITY AND STA


 Glencoe Algebra 1, Student Edition, 9780079039897...AlgebraISBN:9780079039897Author:CarterPublisher:McGraw Hill