Statistical Techniques in Business and Economics
16th Edition
ISBN: 9780077639723
Author: Lind
Publisher: Mcgraw-Hill Course Content Delivery
bartleby

Concept explainers

bartleby

Videos

Question
Book Icon
Chapter 9, Problem 1SR

a.

To determine

Find the population mean of daily sales for Bun-and-Run franchise.

a.

Expert Solution
Check Mark

Explanation of Solution

Here, the sample mean is provided and there is no information about the population mean of daily sales for Bun-and-Run franchise.

b.

To determine

Find the best estimate of the population mean.

b.

Expert Solution
Check Mark

Answer to Problem 1SR

The best estimate of the population mean is $20,000.

Explanation of Solution

Calculation:

The sample mean is the point estimate of the population mean. Moreover, the sample statistic gives the best estimate for the population parameter.

Here, the sample mean is $20,000. Hence, the point estimate of the population mean is $20,000. That is, the best estimate for the population mean is the sample mean, which is denoted as x¯=$20,000_.

c.

To determine

Find the 95% confidence interval for the population mean of daily sales.

c.

Expert Solution
Check Mark

Answer to Problem 1SR

The 95% confidence interval for the population mean of daily sales is ($19,070,$20,930)_.

Explanation of Solution

Calculation:

Step-by-step procedure to obtain the confidence interval using MINITAB software is given below:

  • Choose Stat > Basic Statistics > 1-Sample Z.
  • In Summarized data, enter the sample size as 40 and mean as 20,000.
  • In Standard deviation, enter 3,000.
  • Check Options, enter Confidence level as 95.
  • Choose Mean ≠ Hypothesized mean in alternative.
  • Click OK in all dialogue boxes.

Output using MINITAB software is given below:

Statistical Techniques in Business and Economics, Chapter 9, Problem 1SR

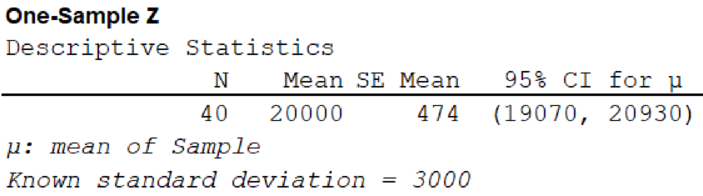
From the MINITAB output, the 95% confidence interval for the population mean of daily sales is ($19,070,$20,930)_.

d.

To determine

Interpret the confidence interval in Part (c).

d.

Expert Solution
Check Mark

Explanation of Solution

Interpretation:

There is 95% confidence that the population mean of daily sales lies between $19,070 and $20,930.

Want to see more full solutions like this?

Subscribe now to access step-by-step solutions to millions of textbook problems written by subject matter experts!

Chapter 9 Solutions

Statistical Techniques in Business and Economics

Ch. 9 - Prob. 9ECh. 9 - Prob. 10ECh. 9 - Prob. 11ECh. 9 - Prob. 12ECh. 9 - Prob. 13ECh. 9 - Prob. 14ECh. 9 - Prob. 3SRCh. 9 - Prob. 15ECh. 9 - Ms. Maria Wilson is considering running for mayor...Ch. 9 - Prob. 17ECh. 9 - Prob. 18ECh. 9 - Prob. 4SRCh. 9 - Prob. 19ECh. 9 - Prob. 20ECh. 9 - Prob. 21ECh. 9 - Prob. 22ECh. 9 - Prob. 23ECh. 9 - Prob. 24ECh. 9 - Prob. 25ECh. 9 - Prob. 26ECh. 9 - The same study of church contributions in Scandia...Ch. 9 - Thirty-six items are randomly selected from a...Ch. 9 - Forty-nine items are randomly selected from a...Ch. 9 - The attendance at the Savannah Colts minor league...Ch. 9 - There are 300 welders employed at Maine Shipyards...Ch. 9 - Prob. 31CECh. 9 - Prob. 32CECh. 9 - Prob. 33CECh. 9 - Prob. 34CECh. 9 - Prob. 35CECh. 9 - Prob. 36CECh. 9 - Prob. 37CECh. 9 - Prob. 38CECh. 9 - Prob. 39CECh. 9 - Prob. 40CECh. 9 - Prob. 41CECh. 9 - Prob. 42CECh. 9 - Prob. 43CECh. 9 - Prob. 44CECh. 9 - Prob. 45CECh. 9 - Prob. 46CECh. 9 - Prob. 47CECh. 9 - Prob. 48CECh. 9 - Prob. 49CECh. 9 - Prob. 50CECh. 9 - Prob. 51CECh. 9 - Prob. 52CECh. 9 - Prob. 53CECh. 9 - Prob. 54CECh. 9 - Prob. 55CECh. 9 - Prob. 56CECh. 9 - Prob. 57CECh. 9 - Prob. 58CECh. 9 - Prob. 59CECh. 9 - Prob. 60CECh. 9 - Prob. 61CECh. 9 - Prob. 62CECh. 9 - Prob. 63CECh. 9 - Prob. 64CECh. 9 - Prob. 65CECh. 9 - Prob. 66CECh. 9 - A sample of 352 subscribers to Wired magazine...Ch. 9 - Prob. 68CECh. 9 - Prob. 70DECh. 9 - Prob. 1PCh. 9 - Prob. 2PCh. 9 - Prob. 3PCh. 9 - Prob. 4PCh. 9 - Prob. 5PCh. 9 - Prob. 6PCh. 9 - Prob. 7PCh. 9 - Prob. 8PCh. 9 - Prob. 9PCh. 9 - Prob. 10PCh. 9 - Prob. 11PCh. 9 - Prob. 12PCh. 9 - Prob. 13PCh. 9 - Prob. 1CCh. 9 - Prob. 1.1PTCh. 9 - Prob. 1.2PTCh. 9 - Prob. 1.3PTCh. 9 - Prob. 1.4PTCh. 9 - Prob. 1.5PTCh. 9 - Prob. 1.6PTCh. 9 - Prob. 1.7PTCh. 9 - Prob. 1.8PTCh. 9 - Prob. 1.9PTCh. 9 - Prob. 1.10PTCh. 9 - Prob. 2.1PTCh. 9 - Prob. 2.2PTCh. 9 - Prob. 2.3PTCh. 9 - Prob. 2.4PT
Knowledge Booster
Background pattern image
Statistics
Learn more about
Need a deep-dive on the concept behind this application? Look no further. Learn more about this topic, statistics and related others by exploring similar questions and additional content below.
Recommended textbooks for you
Text book image
Glencoe Algebra 1, Student Edition, 9780079039897...
Algebra
ISBN:9780079039897
Author:Carter
Publisher:McGraw Hill
Statistics 4.1 Point Estimators; Author: Dr. Jack L. Jackson II;https://www.youtube.com/watch?v=2MrI0J8XCEE;License: Standard YouTube License, CC-BY
Statistics 101: Point Estimators; Author: Brandon Foltz;https://www.youtube.com/watch?v=4v41z3HwLaM;License: Standard YouTube License, CC-BY
Central limit theorem; Author: 365 Data Science;https://www.youtube.com/watch?v=b5xQmk9veZ4;License: Standard YouTube License, CC-BY
Point Estimate Definition & Example; Author: Prof. Essa;https://www.youtube.com/watch?v=OTVwtvQmSn0;License: Standard Youtube License
Point Estimation; Author: Vamsidhar Ambatipudi;https://www.youtube.com/watch?v=flqhlM2bZWc;License: Standard Youtube License