
Concept explainers
(a)
To determine:
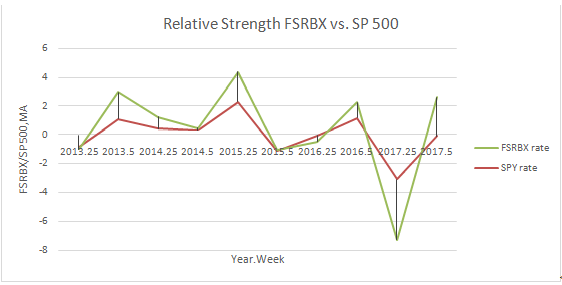
To set the spreadsheet for calculating the relative strength of the banking sector compared to the broad market.
Introduction:
Relative strength helps to measure the extent to which a security has underperformed or it has outperformed its own industry or the entire market. Relative strength is a ratio of price of security to industry price index.
Answer to Problem 26PS
The spreadsheet is obtained and given in explanation.
Explanation of Solution
Given Information:
The data given in the website. The initial value of the sector index and S&P 500 Index is equal to 100. Each week's
The data was downloaded from the given website.
| Week | SPY rate | FSRBX rate |
| 2013.01 | 1.64 | 1.75 |
| 2013.02 | 0.17 | 0.55 |
| 2013.03 | -0.82 | -0.92 |
| 2013.04 | 0.85 | 0.93 |
| 2013.05 | 0.59 | 0.92 |
| 2013.06 | -0.21 | -0.08 |
| 2013.07 | 0.12 | 1.37 |
| 2013.08 | 1.19 | 1.80 |
| 2013.09 | -3.27 | -2.73 |
| 2013.10 | -1.00 | -0.58 |
| 2013.11 | -0.03 | -0.87 |
| 2013.12 | 3.25 | 1.09 |
| 2013.13 | -0.23 | -0.21 |
| 2013.14 | -0.47 | -3.37 |
| 2013.15 | 0.47 | 0.00 |
| 2013.16 | -2.97 | -1.55 |
| 2013.17 | -0.91 | -1.75 |
| 2013.18 | 0.07 | 0.40 |
| 2013.19 | -0.20 | 1.11 |
| 2013.20 | 2.77 | 2.50 |
| 2013.21 | 0.11 | 0.04 |
| 2013.22 | 1.21 | 0.38 |
| 2013.23 | -0.27 | -0.89 |
| 2013.24 | 0.19 | 0.52 |
| 2013.25 | -0.85 | -0.17 |
| 2013.26 | -1.02 | -1.16 |
| 2013.27 | -0.92 | 0.04 |
| 2013.28 | -1.57 | 0.04 |
| 2013.29 | 1.72 | 0.95 |
| 2013.30 | -3.60 | -1.97 |
| 2013.31 | 0.32 | 0.83 |
| 2013.32 | 3.07 | 3.47 |
| 2013.33 | 0.88 | 1.05 |
| 2013.34 | 0.59 | 0.58 |
| 2013.35 | 0.85 | 0.54 |
| 2013.36 | 0.50 | 0.21 |
| 2013.37 | -1.49 | -1.72 |
| 2013.38 | 1.96 | 2.08 |
| 2013.39 | -1.00 | 0.16 |
| 2013.40 | -1.11 | -0.37 |
| 2013.41 | -1.13 | -1.51 |
| 2013.42 | 2.91 | 3.28 |
| 2013.43 | 3.61 | 2.73 |
| 2013.44 | 1.29 | 1.60 |
| 2013.45 | -0.86 | -2.16 |
| 2013.46 | 0.79 | 1.18 |
| 2013.47 | 0.76 | 0.19 |
| 2013.48 | 0.06 | -0.19 |
| 2013.49 | 0.57 | 0.04 |
| 2013.50 | 1.11 | 1.83 |
| 2013.51 | 0.08 | -0.15 |
| 2013.52 | -2.01 | -2.22 |
| 2014.01 | -0.17 | -1.56 |
| 2014.02 | -1.24 | 0.16 |
| 2014.03 | 0.56 | -0.28 |
| 2014.04 | 2.38 | 2.74 |
| 2014.05 | 0.45 | -0.39 |
| 2014.06 | -0.32 | -2.45 |
| 2014.07 | 0.87 | 0.36 |
| 2014.08 | 1.07 | 1.63 |
| 2014.09 | -1.91 | -1.87 |
| 2014.10 | -1.15 | -1.23 |
| 2014.11 | -1.18 | -2.58 |
| 2014.12 | 0.25 | 0.29 |
| 2014.13 | 0.48 | 0.66 |
| 2014.14 | -3.26 | -2.29 |
| 2014.15 | 1.24 | 0.75 |
| 2014.16 | 0.16 | 1.54 |
| 2014.17 | 1.15 | 0.78 |
| 2014.18 | -1.17 | -1.30 |
| 2014.19 | 2.93 | 3.13 |
| 2014.20 | 0.96 | -0.52 |
| 2014.21 | -0.09 | -0.36 |
| 2014.22 | 0.05 | -0.04 |
| 2014.23 | 1.37 | 1.65 |
| 2014.24 | -1.96 | -1.07 |
| 2014.25 | 0.46 | 0.80 |
| 2014.26 | 1.49 | 1.19 |
| 2014.27 | 1.26 | 1.65 |
| 2014.28 | 0.57 | 0.35 |
| 2014.29 | 0.16 | -0.92 |
| 2014.30 | -0.69 | -1.24 |
| 2014.31 | 0.14 | 0.04 |
| 2014.32 | -0.47 | 0.39 |
| 2014.33 | -1.39 | -1.92 |
| 2014.34 | 1.24 | 1.00 |
| 2014.35 | 1.91 | 0.63 |
| 2014.36 | -0.46 | 0.08 |
| 2014.37 | -1.67 | -2.36 |
| 2014.38 | 1.32 | -0.08 |
| 2014.39 | -2.79 | -1.73 |
| 2014.40 | -0.78 | 0.04 |
| 2014.41 | -0.45 | 1.02 |
| 2014.42 | 1.41 | 2.23 |
| 2014.43 | 1.93 | 1.03 |
| 2014.44 | 1.35 | 3.02 |
| 2014.45 | 1.10 | -0.19 |
| 2014.46 | 1.60 | 1.72 |
| 2014.47 | -0.22 | -0.68 |
| 2014.48 | -0.41 | -0.38 |
| 2014.49 | 0.55 | 0.72 |
| 2014.50 | 0.31 | 0.19 |
| 2014.51 | -1.77 | -1.73 |
| 2014.52 | 3.15 | 2.41 |
| 2015.01 | 0.19 | -0.52 |
| 2015.02 | -2.10 | -2.89 |
| 2015.03 | 2.04 | 2.59 |
| 2015.04 | -1.76 | -1.81 |
| 2015.05 | 0.29 | 0.81 |
| 2015.06 | 1.72 | 1.71 |
| 2015.07 | 0.47 | 1.35 |
| 2015.08 | -0.50 | -1.07 |
| 2015.09 | -0.13 | 0.07 |
| 2015.1 | 1.99 | 2.13 |
| 2015.11 | -0.32 | -0.51 |
| 2015.12 | -0.29 | -0.66 |
| 2015.13 | -0.23 | -0.04 |
| 2015.14 | -0.64 | -0.41 |
| 2015.15 | 1.90 | 1.37 |
| 2015.16 | 0.24 | 3.11 |
| 2015.17 | 0.80 | 0.57 |
| 2015.18 | -2.48 | -2.76 |
| 2015.19 | -1.66 | -1.49 |
| 2015.2 | 1.01 | 0.59 |
| 2015.21 | 0.48 | 1.06 |
| 2015.22 | -2.83 | -0.80 |
| 2015.23 | -0.12 | -1.72 |
| 2015.24 | -0.17 | -1.60 |
| 2015.25 | 2.29 | 2.08 |
| 2015.26 | -0.53 | -0.11 |
| 2015.27 | -2.44 | -1.30 |
| 2015.28 | 0.34 | 2.67 |
| 2015.29 | 3.25 | 2.31 |
| 2015.3 | 0.17 | 0.72 |
| 2015.31 | -0.93 | -1.99 |
| 2015.32 | 2.89 | 1.88 |
| 2015.33 | -0.67 | -1.14 |
| 2015.34 | 1.23 | 0.54 |
| 2015.35 | -0.86 | -0.54 |
| 2015.36 | 1.73 | 1.80 |
| 2015.37 | -0.38 | -0.25 |
| 2015.38 | 1.61 | 0.78 |
| 2015.39 | 1.08 | 0.67 |
| 2015.4 | 1.20 | 0.87 |
| 2015.41 | 0.15 | -1.21 |
| 2015.42 | 0.78 | 0.28 |
| 2015.43 | -1.00 | -1.01 |
| 2015.44 | 1.25 | 1.62 |
| 2015.45 | 1.58 | 0.28 |
| 2015.46 | -0.05 | -0.62 |
| 2015.47 | -0.09 | -0.49 |
| 2015.48 | 0.85 | 1.12 |
| 2015.49 | 0.65 | 2.04 |
| 2015.5 | -1.11 | 0.03 |
| 2015.51 | 0.62 | 0.34 |
| 2015.52 | -0.76 | -0.74 |
| 2016.01 | 1.92 | 0.34 |
| 2016.02 | -0.29 | -0.65 |
| 2016.03 | -0.48 | -0.27 |
| 2016.04 | 1.88 | 1.78 |
| 2016.05 | -0.60 | -0.20 |
| 2016.06 | 1.24 | 1.82 |
| 2016.07 | -0.29 | -0.50 |
| 2016.08 | -4.57 | -4.10 |
| 2016.09 | 1.52 | 0.35 |
| 2016.1 | -1.21 | -1.77 |
| 2016.11 | 3.51 | 3.45 |
| 2016.12 | -0.97 | -2.21 |
| 2016.13 | 1.58 | -0.31 |
| 2016.14 | 0.74 | -0.24 |
| 2016.15 | 2.27 | 3.50 |
| 2016.16 | 0.61 | -0.30 |
| 2016.17 | 0.93 | 0.95 |
| 2016.18 | -0.03 | 0.34 |
| 2016.19 | 1.16 | 0.60 |
| 2016.2 | -0.61 | -0.97 |
| 2016.21 | 1.57 | 0.84 |
| 2016.22 | -1.97 | -2.20 |
| 2016.23 | 1.78 | 1.47 |
| 2016.24 | -1.64 | -2.55 |
| 2016.25 | -0.08 | -0.41 |
| 2016.26 | 1.70 | 1.18 |
| 2016.27 | 1.22 | 0.24 |
| 2016.28 | -0.87 | -3.31 |
| 2016.29 | -5.46 | -5.40 |
| 2016.3 | -0.90 | -4.03 |
| 2016.31 | 0.63 | 5.80 |
| 2016.32 | 0.00 | 3.71 |
| 2016.33 | 2.51 | 0.07 |
| 2016.34 | -0.50 | -1.49 |
| 2016.35 | -1.03 | -2.52 |
| 2016.36 | 1.94 | 1.66 |
| 2016.37 | 2.55 | 2.50 |
| 2016.38 | 0.40 | -1.74 |
| 2016.39 | 2.14 | 4.61 |
| 2016.4 | 0.31 | -2.58 |
| 2016.41 | -4.26 | -7.57 |
| 2016.42 | 2.63 | 2.98 |
| 2016.43 | -1.57 | -6.13 |
| 2016.44 | -4.01 | -2.14 |
| 2016.45 | 0.45 | -1.90 |
| 2016.46 | -1.14 | -2.72 |
| 2016.47 | 3.15 | 5.34 |
| 2016.48 | 1.52 | -0.24 |
| 2016.49 | -2.48 | -6.53 |
| 2016.5 | 1.18 | 1.08 |
| 2016.51 | -0.56 | -1.15 |
| 2016.52 | -4.06 | -6.69 |
| 2017.01 | -0.82 | 0.56 |
| 2017.02 | -5.77 | -7.23 |
| 2017.03 | 0.75 | 10.91 |
| 2017.04 | 4.91 | 7.74 |
| 2017.05 | -4.67 | -6.93 |
| 2017.06 | 1.56 | -1.07 |
| 2017.07 | 0.35 | 0.45 |
| 2017.08 | -1.32 | -5.12 |
| 2017.09 | -3.08 | -6.53 |
| 2017.1 | -0.07 | 1.77 |
| 2017.11 | 2.41 | 11.69 |
| 2017.12 | -0.43 | -7.26 |
| 2017.13 | 4.09 | 3.60 |
| 2017.14 | -2.56 | -4.91 |
| 2017.15 | 3.82 | 4.78 |
| 2017.16 | 0.81 | 2.42 |
| 2017.17 | 1.37 | 1.95 |
| 2017.18 | -1.85 | -4.99 |
| 2017.19 | 2.70 | 1.13 |
| 2017.2 | -3.52 | -4.13 |
| 2017.21 | 1.96 | 0.15 |
| 2017.22 | -2.89 | -7.05 |
| 2017.23 | -0.11 | -4.31 |
| 2017.24 | -2.87 | -4.07 |
| 2017.25 | -3.08 | -4.19 |
| 2017.26 | -0.96 | -4.67 |
| 2017.27 | -1.95 | -6.75 |
| 2017.28 | 1.72 | 12.69 |
| 2017.29 | -0.40 | 1.30 |
| 2017.3 | 0.55 | 7.63 |
| 2017.31 | 2.54 | 1.03 |
| 2017.32 | 0.62 | -1.55 |
| 2017.33 | -0.40 | -3.05 |
| 2017.34 | -0.66 | 3.25 |
| 2017.35 | -3.40 | 3.86 |
| 2017.36 | 1.35 | 2.30 |
| 2017.37 | -0.99 | 10.94 |
| 2017.38 | -2.63 | -10.46 |
| 2017.39 | -8.70 | -5.66 |
| 2017.4 | -19.79 | -18.66 |
| 2017.41 | 5.33 | 9.99 |
| 2017.42 | -6.63 | -7.68 |
| 2017.43 | 11.25 | 13.61 |
| 2017.44 | -3.07 | -8.20 |
| 2017.45 | -7.71 | -6.40 |
| 2017.46 | -8.19 | -20.03 |
| 2017.47 | 13.29 | 25.04 |
| 2017.48 | -2.39 | -0.34 |
| 2017.49 | 1.20 | -6.79 |
| 2017.5 | -0.09 | 2.69 |
| 2017.51 | -1.17 | -2.55 |
| 2017.52 | 6.66 | -0.29 |
The graph of the relative strength for S&P 500 and FB is plotted as shown below.
Using the price movements and their changing speed, the relative strength of the fund against the S&P 500 can be measured.
(b)
To determine:
To determine the instances where the relative strength ratio exceeds by minimum 5% from its 5 weeks prior value and to determine the number of weeks immediately following the substantial increase the banking sector outperforms S&P500 and how many weeks banking sector underperforms S&P500.
Introduction:
Relative strength helps to measure the extent to which a security has underperformed or it has outperformed its own industry or the entire market. Relative strength is a ratio of price of security to industry price index.
Answer to Problem 26PS
As per the data, 16 times the relative strength increases more than 5%.
Explanation of Solution
Given Information:
The data is available in the given website.
Of the 255 total instances, there are 16 times when the relative strength increases by greater than 5% over the interval of 5 weeks.
Here, it is seen that 10 times the FSRBX underperformed the S&P 500 following the increase of more than 5%.
There are 6 times that FSRBX outperformed S&P 500 following the increase of more than 5%.
(c)
Requirement 3 To Determine:
To determine the instances where the relative strength ratio decreases by minimum 5% from its 5 weeks prior value and to determine the number of weeks immediately following the substantial decrease the banking sector outperforms S&P 500 and how many weeks banking sector underperforms S&P 500.
Introduction:
Relative strength helps to measure the extent to which a security has underperformed or it has outperformed its own industry or the entire market. Relative strength is a ratio of price of security to industry price index.
Answer to Problem 26PS
As per the data, 31 times the relative strength moves decrease by greater than 5%.
Explanation of Solution
Given Information:
The data is available in the given website.
Of the 255 total instances, there are 31 times when the relative strength decreases by greater than 5% over the interval of 5 weeks.
Here it is seen that 17 times the FSRBX underperformed S&P 500 following the decrease of more than 5%.
There are 14 times that FSRBX outperformed S&P 500 following the decrease of more than 5%.
(d)
Requirement 4 To Determine:
To determine how well the relative strength rule functions in identifying the selling or buying opportunities.
Introduction:
Relative strength helps to measure the extent to which a security has underperformed or it has outperformed its own industry or the entire market. Relative strength is a ratio of price of security to industry price index.
Answer to Problem 26PS
The data above gives the bullish sign and the bearish sign.
Explanation of Solution
Given Information:
The data is available in the given website.
We can see the relative strength depicted in second part of requirement as bullish sign. Here the FB fund is likely to underperform the S&P 500 index than to perform better than the index according to this signal.
We can see the relative strength depicted in third part of requirement as bearish sign. Here the FB fund did not give a better performance than the index but there is no statistical difference succeeding the considerable change in the relative strength. There is random successive performance.
Want to see more full solutions like this?
Chapter 9 Solutions
Essentials of Investments (The Mcgraw-hill/Irwin Series in Finance, Insurance, and Real Estate)


 Essentials Of InvestmentsFinanceISBN:9781260013924Author:Bodie, Zvi, Kane, Alex, MARCUS, Alan J.Publisher:Mcgraw-hill Education,

 Foundations Of FinanceFinanceISBN:9780134897264Author:KEOWN, Arthur J., Martin, John D., PETTY, J. WilliamPublisher:Pearson,
 Fundamentals of Financial Management (MindTap Cou...FinanceISBN:9781337395250Author:Eugene F. Brigham, Joel F. HoustonPublisher:Cengage Learning
 Corporate Finance (The Mcgraw-hill/Irwin Series i...FinanceISBN:9780077861759Author:Stephen A. Ross Franco Modigliani Professor of Financial Economics Professor, Randolph W Westerfield Robert R. Dockson Deans Chair in Bus. Admin., Jeffrey Jaffe, Bradford D Jordan ProfessorPublisher:McGraw-Hill Education