
Videos
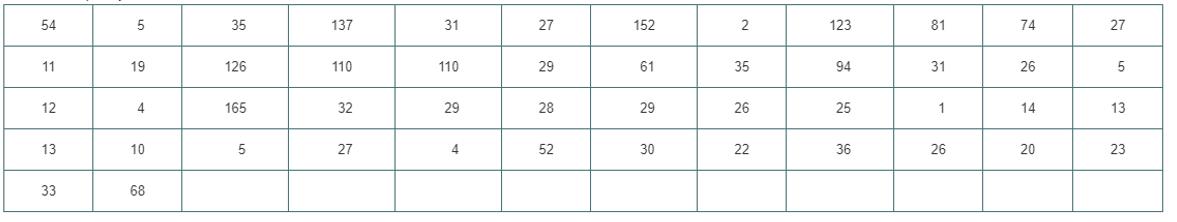
One of the major measures of the quality of Service Provided by any organization in the speed with which it responds to customer complaints. A large family-held department store selling furniture and flooring, including carpet, had undergone a Major expansion in the past several years. In particular, the flooring department had expanded from 2 installation crews to an installation supervisor, a measurer, and 15 installation crews. The store had the business objective of improving its response to complaints. The variables of interest was defined as the number of days between when the complaint was made and when it was resolved. Data were collected from 50 complaints that were made in the past year. These data, stored in Furniture, are:
a. The installation supervisor claims that the
b. What assumption about the population distribution is needed in order to conduct the t test in (a)?
c. Construct a boxplot or a normal probability plot to evaluate the assumption made in (b).
d. Do you think that the assumption needed in order to conduct the t test in (a) is valid? Explain.
Want to see the full answer?
Check out a sample textbook solution
Chapter 9 Solutions
BASIC BUSINESS STATISTICS-STUD.SOLN.MAN


- Name the four characteristics of a good definition.arrow_forwardA company that operated 10 hours a day manufactures two products on three sequential processes. The following table summarizes the data for the problem: Please answer the two questionsarrow_forwardOne of the major measures of the quality of service provided by an organization is the speed with which the organization responds to customer complaints. A large family-held department store selling furniture and flooring, including carpet, had undergone a major expansion in the past several years. In particular, the flooring department had expanded from 2 installation crews to an installation supervisor, a measurer, and 15 installation crews. A business objective of the company was to reduce the time between when the complaint is received and when it is resolved. During a recent year, the company received 50 complaints concerning carpet installation. The data from the 50 complaints, represent the number of days between the receipt of the complaint and the resolution of the complaint: 54 5 35 137 31 27 152 2 123 81 74 27 11 19 126 110 110 29 61 35 94 31 26 5 12 4 165 32 29 28 29 26 25 1 14 13 13 10 5 27 4 52 30 22 36 26 20 23 33 68 Construct a cumulative percentage distribution and…arrow_forward
- One of the major measures of the quality of service provided by an organization is the speed with which the organization responds to customer complaints. A large family-held department store selling furniture and flooring, including carpet, had undergone a major expansion in the past several years. In particular, the flooring department had expanded from 2 installation crews to an installation supervisor, a measurer, and 15 installation crews. A business objective of the company was to reduce the time between when the complaint is received and when it is resolved. During a recent year, the company received 50 complaints concerning carpet installation. The data from the 50 complaints, represent the number of days between the receipt of the complaint and the resolution of the complaint: 54 5 35 137 31 27 152 2 123 81 74 27 11 19 126 110 110 29 61 35 94 31 26 5 12 4 165 32 29 28 29 26 25 1 14 13 13 10 5 27 4 52 30 22 36 26 20 23 33 68 Construct a frequency distribution and a percentage…arrow_forwardOne of the major measures of the quality of service provided by an organization is the speed with which the organization responds to customer complaints. A large family-held department store selling furniture and flooring, including carpet, had undergone a major expansion in the past several years. In particular, the flooring department had expanded from 2 installation crews to an installation supervisor, a measurer, and 15 installation crews. A business objective of the company was to reduce the time between when the complaint is received and when it is resolved. During a recent year, the company received 50 complaints concerning carpet installation. The data from the 50 complaints, represent the number of days between the receipt of the complaint and the resolution of the complaint: 54 5 35 137 31 27 152 2 123 81 74 27 11 19 126 110 110 29 61 35 94 31 26 5 12 4 165 32 29 28 29 26 25 1 14 13 13 10 5 27 4 52 30 22 36 26 20 23 33 68 Construct a histogram and a percentage polygon.arrow_forwardThe Conch Café, located in Gulf Shores, Alabama, features casual lunches with a great view of the Gulf of Mexico. To accommodate the increase in business during the summer vacation season, Fuzzy Conch, the owner, hires a large number of servers as seasonal help. When he interviews a prospective server, he would like to provide data on the amount a server can earn in tips. He believes that the amount of the bill and the number of diners are both related to the amount of the tip. He gathered the following sample information. Customer Amount of Tip Amount of Bill Number of Diners Customer Amount of Tip Amount of Bill Number of Diners 1 $ 7.00 $ 48.97 5 16 $ 3.30 $ 23.59 2 2 4.50 28.23 4 17 3.50 22.30 2 3 1.00 10.65 1 18 3.25 32.00 2 4 2.40 19.82 3 19 5.40 50.02 4 5 5.00 28.62 3 20 2.25 17.60 3 6 4.25 24.83 2 21 5.50 44.47 4 7 0.50 6.24 1 22 3.00 20.27 2…arrow_forward
- The Conch Café, located in Gulf Shores, Alabama, features casual lunches with a great view of the Gulf of Mexico. To accommodate the increase in business during the summer vacation season, Fuzzy Conch, the owner, hires a large number of servers as seasonal help. When he interviews a prospective server, he would like to provide data on the amount a server can earn in tips. He believes that the amount of the bill and the number of diners are both related to the amount of the tip. He gathered the following sample information. Customer Amount of Tip Amount of Bill Number of Diners Customer Amount of Tip Amount of Bill Number of Diners 1 $ 6.05 $ 73.22 1 16 $ 3.30 $ 23.59 2 2 4.50 28.23 4 17 3.50 22.30 2 3 1.00 10.65 1 18 3.25 32.00 2 4 2.40 19.82 3 19 5.40 50.02 4 5 5.00 28.62 3 20 2.25 17.60 3 6 4.25 24.83 2 21 1.40 41.80 5 7 .50 6.25 1 22 3.00 20.27 2…arrow_forwardCompanies in the U.S. car rental market vary greatly in terms of the size of the fleet, the number of locations, and annual revenue. In 2011, Hertz had 320,000 cars in service and annual revenue of approximately $4.2 billion. Suppose the following data show the number of cars in service (1,000s) and the annual revenue ($ millions) for six smaller car rental companies. Company Cars (1,000s) Revenue ($ millions) Company A 11.5 116 Company B 10 137 Company C 9 102 Company D 5.5 39 Company E 4.2 38 Company F 3.3 30 (a) Develop a scatter diagram with the number of cars in service as the independent variable. (b) What does the scatter diagram developed in part (a) indicate about the relationship between the two variables? (c) Use the least squares method to develop the estimated regression equation that can be used to predict annual revenue (in $ millions) given the number of cars in service (in 1,000s). (Round your numerical values to three decimal…arrow_forwardCompanies in the U.S. car rental market vary greatly in terms of the size of the fleet, the number of locations, and annual revenue. In 2011, Hertz had 320,000 cars in service and annual revenue of approximately $4.2 billion. Suppose the following data show the number of cars in service (1,000s) and the annual revenue ($ millions) for six smaller car rental companies. Company Cars(1,000s) Revenue($ millions) Company A 11.5 118 Company B 10.0 137 Company C 9.0 102 Company D 5.5 39 Company E 4.2 40 Company F 3.3 32 (a) Develop a scatter diagram with the number of cars in service as the independent variable. A scatter diagram has 6 points plotted on it. The horizontal axis ranges from 0 to 14 and is labeled: Cars in Service (1,000s). The vertical axis ranges from 0 to 160 and is labeled: Annual Revenue ($ millions). The points are plotted from left to right in an upward, diagonal direction starting from the lower left corner of the diagram and are between 3 to 12 on…arrow_forward
 Algebra: Structure And Method, Book 1AlgebraISBN:9780395977224Author:Richard G. Brown, Mary P. Dolciani, Robert H. Sorgenfrey, William L. ColePublisher:McDougal Littell
 Elementary Geometry For College Students, 7eGeometryISBN:9781337614085Author:Alexander, Daniel C.; Koeberlein, Geralyn M.Publisher:Cengage,