
Pearson eText for Essentials of Statistics -- Instant Access (Pearson+)
6th Edition
ISBN: 9780137517374
Author: Mario Triola
Publisher: PEARSON+
expand_more
expand_more
format_list_bulleted
Videos
Textbook Question
Chapter 9, Problem 5RE
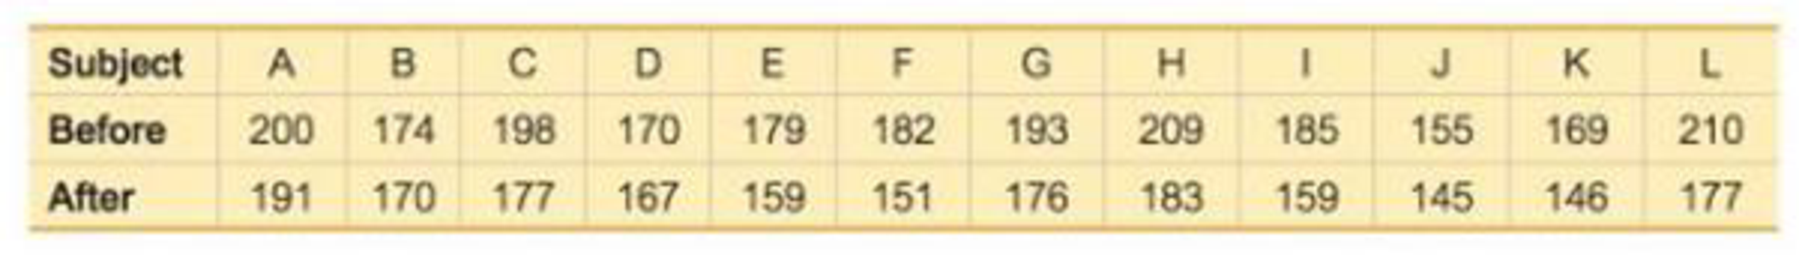
Before /After Treatment Results Captopril is a drug designed to lower systolic blood pressure. When subjects were treated with this drug, their systolic blood pressure readings (in mm Hg) were measured before and after the drug was taken. Results are given in the accompanying table (based on data from “Essential Hypertension: Effect of an Oral Inhibitor of Angiotensin-Converting Enzyme,” by MacGregor et al., British Medical Journal, Vol. 2). Using a 0.01 significance level, is there sufficient evidence to support the claim that captopril is effective in lowering systolic blood pressure?
Expert Solution & Answer
Want to see the full answer?
Check out a sample textbook solution
Students have asked these similar questions
Before/After Treatment Results Captopril is a drug designed to lower systolic blood pressure. When subjects were treated with this drug, their systolic blood pressure readings (in mm Hg) were measured before and after the drug was taken. Results are given in the accompanying table (based on data from “Essential Hypertension: Effect of an Oral Inhibitor of Angiotensin-Converting Enzyme,” by MacGregor et al., British Medical Journal, Vol. 2). Using a 0.01 significance level, is there sufficient evidence to support the claim that Captopril is effective in lowering systolic blood pressure?
Is the birth rate of the infants in this sample significantly different from that of the general population at alpha level of 0.05? Explain your response.
A sample of 10 diesel trucks were run both hot and cold to estimate the difference in fuel
economy. The results, in mpg. are presented in the following table. (From "In-use
Emissions from Heavy-Duty Diesel Vehicles," J. Yanowitz, Ph.D. thesis, Colorado School
of Mines, 2001.)
Truck
Hot
Cold
4.56
4.26
2
4.46
4.08
3
6.49
5.83
5.37
4.96
5
6.25
5.87
6
5.90
5.32
4.12
3.92
8
3.85
3.69
4.15
3.74
10
4.69
4.19
Find a 98% confidence interval for the difference in mean fuel mileage between hot and
cold engines.
Chapter 9 Solutions
Pearson eText for Essentials of Statistics -- Instant Access (Pearson+)
Ch. 9.1 - Verifying Requirements In the largest clinical...Ch. 9.1 - Verifying Requirements In the largest clinical...Ch. 9.1 - Hypotheses and Conclusions Refer to the hypothesis...Ch. 9.1 - Using Confidence Intervals a. Assume that we want...Ch. 9.1 - Interpreting Displays. In Exercises 5 and 6, use...Ch. 9.1 - Treating Carpal Tunnel Syndrome Carpal tunnel...Ch. 9.1 - Testing Claims About Proportions. In Exercises...Ch. 9.1 - Accuracy of Fast Food Drive-Through Orders In a...Ch. 9.1 - Testing Claims About Proportions. In Exercises...Ch. 9.1 - Testing Claims About Proportions. In Exercises...
Ch. 9.1 - Testing Claims About Proportions. In Exercises...Ch. 9.1 - Testing Claims About Proportions. In Exercises...Ch. 9.1 - Testing Claims About Proportions. In Exercises...Ch. 9.1 - Testing Claims About Proportions. In Exercises...Ch. 9.1 - Testing Claims About Proportions. In Exercises...Ch. 9.1 - Prob. 16BSCCh. 9.1 - Testing Claims About Proportions. In Exercises...Ch. 9.1 - Testing Claims About Proportions. In Exercises...Ch. 9.1 - Testing Claims About Proportions. In Exercises...Ch. 9.1 - Testing Claims About Proportions. In Exercises...Ch. 9.1 - Testing Claims About Proportions. In Exercises...Ch. 9.1 - Testing Claims About Proportions. In Exercises...Ch. 9.1 - Prob. 23BBCh. 9.1 - Yawning and Fishers Exact Test In one segment of...Ch. 9.1 - Overlap of Confidence Intervals In the article On...Ch. 9.1 - Equivalence of Hypothesis Test and Confidence...Ch. 9.2 - Independent and Dependent Samples Which of the...Ch. 9.2 - Confidence Interval for Hemoglobin Large samples...Ch. 9.2 - Hypothesis Tests and Confidence Intervals for...Ch. 9.2 - Degrees of Freedom For Example 1 on page 431, we...Ch. 9.2 - In Exercises 520, assume that the two samples are...Ch. 9.2 - In Exercises 520, assume that the two samples are...Ch. 9.2 - In Exercises 520, assume that the two samples are...Ch. 9.2 - In Exercises 520, assume that the two samples are...Ch. 9.2 - In Exercises 520, assume that the two samples are...Ch. 9.2 - In Exercises 520, assume that the two samples are...Ch. 9.2 - In Exercises 520, assume that the two samples are...Ch. 9.2 - In Exercises 520, assume that the two samples are...Ch. 9.2 - In Exercises 520, assume that the two samples are...Ch. 9.2 - In Exercises 520, assume that the two samples are...Ch. 9.2 - In Exercises 520, assume that the two samples are...Ch. 9.2 - In Exercises 520, assume that the two samples are...Ch. 9.2 - In Exercises 520, assume that the two samples are...Ch. 9.2 - In Exercises 520, assume that the two samples are...Ch. 9.2 - In Exercises 520, assume that the two samples are...Ch. 9.2 - In Exercises 520, assume that the two samples are...Ch. 9.2 - Pooling Repeat Exercise 12 IQ and Lead by assuming...Ch. 9.2 - Degrees of Freedom In Exercise 20 Blanking Out on...Ch. 9.2 - No Variation in a Sample An experiment was...Ch. 9.3 - True? For the methods of this section, which of...Ch. 9.3 - Notation Listed below are body temperatures from...Ch. 9.3 - Units of Measure If the values listed in Exercise...Ch. 9.3 - Degrees of Freedom If we use the sample data in...Ch. 9.3 - In Exercises 516, use the listed paired sample...Ch. 9.3 - In Exercises 516, use the listed paired sample...Ch. 9.3 - In Exercises 516, use the listed paired sample...Ch. 9.3 - In Exercises 516, use the listed paired sample...Ch. 9.3 - In Exercises 516, use the listed paired sample...Ch. 9.3 - In Exercises 516, use the listed paired sample...Ch. 9.3 - Prob. 11BSCCh. 9.3 - Prob. 12BSCCh. 9.3 - In Exercises 516, use the listed paired sample...Ch. 9.3 - In Exercises 516, use the listed paired sample...Ch. 9.3 - In Exercises 516, use the listed paired sample...Ch. 9.3 - In Exercises 516, use the listed paired sample...Ch. 9 - In Exercises 15, use the following survey results:...Ch. 9 - In Exercises 1-5, use the following survey...Ch. 9 - In Exercises 1-5, use the following survey...Ch. 9 - In Exercises 1-5, use the following survey...Ch. 9 - In Exercises 7-5, use the following survey...Ch. 9 - True? Determine whether the following statement is...Ch. 9 - True? When we collect random samples to test the...Ch. 9 - Dependent or Independent? Listed below are...Ch. 9 - Hypotheses Identify the null and alternative...Ch. 9 - Test Statistics Identify the test statistic that...Ch. 9 - Denomination Effect In the article The...Ch. 9 - Denomination Effect Construct the confidence...Ch. 9 - Heights Listed below are heights (cm) randomly...Ch. 9 - Heights Use a 0.01 significance level with the...Ch. 9 - Before /After Treatment Results Captopril is a...Ch. 9 - Eyewitness Accuracy of Police Does stress affect...Ch. 9 - Are Flights Cheaper When Scheduled Earlier? Listed...Ch. 9 - Family Heights. In Exercises 15, use the following...Ch. 9 - Scatterplot Construct a scatterplot of the...Ch. 9 - Family Heights. In Exercises 1-5, use the...Ch. 9 - Family Heights. In Exercises 1-5, use the...Ch. 9 - Assessing Normality Interpret the normal quantile...Ch. 9 - Braking Reaction Times: Histogram Listed below are...Ch. 9 - Braking Reaction Times: Normal? The accompanying...Ch. 9 - Braking Reaction Times: Boxplots Use the same data...Ch. 9 - In Exercises 5-20, assume that the two samples are...Ch. 9 - Braking Reaction Times: Confidence Intervals a....Ch. 9 - FROM DATA TO DECISION Critical Thinking: Did the...Ch. 9 - Critical Thinking: Did the NFL Rule Change Have...Ch. 9 - Critical Thinking: Did the NFL Rule Change Have...
Knowledge Booster


Learn more about
Need a deep-dive on the concept behind this application? Look no further. Learn more about this topic, statistics and related others by exploring similar questions and additional content below.Similar questions
- “Passive and Active Smoke” in Appendix B includes cotinine levels measured in a group of nonsmokers exposed to tobacco smoke (n = 40, Mean = 60.58 ng>mL, s = 138.08 ng>mL) and a group of nonsmokers not exposed to tobacco smoke (n = 40, Mean = 16.35 ng>mL, s = 62.53 ng>mL). Cotinine is a metabolite of nicotine, meaning that when nicotine is absorbed by the body, cotinine is produced. Use a 0.05 significance level to test the claim that nonsmokers exposed to tobacco smoke have a higher mean cotinine level than nonsmokers not exposed to tobacco smoke. Based on your hypothesis tests and confidence intervals, what do you conclude about the effects of second hand smoke? Why?arrow_forward“Passive and Active Smoke” in Appendix B includes cotinine levels measured in a group of nonsmokers exposed to tobacco smoke (n = 40, Mean = 60.58 ng>mL, s = 138.08 ng>mL) and a group of nonsmokers not exposed to tobacco smoke (n = 40, Mean = 16.35 ng>mL, s = 62.53 ng>mL). Cotinine is a metabolite of nicotine, meaning that when nicotine is absorbed by the body, cotinine is produced. Use a 0.05 significance level to test the claim that nonsmokers exposed to tobacco smoke have a higher mean cotinine level than nonsmokers not exposed to tobacco smoke. 1. Construct a confidence interval estimate of the difference betwen the mean continen levels fo the two groups of nonsmokers. What confidence level would be appropriate? 2. Find the margin of error E using the formula. 3. What is the confidence interval? Explain the meaning of the confidence interal and what the limit represents.arrow_forwardDr. Palmer found a small treatment effect. What can she do in improve her changes of finding a statistically significant result?arrow_forward
- Each year the US Environmental Protection Agency (EPA) releases fuel economy data on cars manufactured in that year. Below are summary statistics on fuel efficiency (in miles/gallon for city driving) from random samples of cars with manual and automatic transmissions manufactured in 2012. We want to know if there is a statistical difference between the average fuel efficiencies between the two different types of transmission. Automatic Transmission Manual Transmission X1 = 15.7 Si = 3.6 N1 = 26 T2 = 19 S2 = 4.65 N2 = 34 Mean %3D SD Sample Size (a) Calculate the standard error for the appropriate sampling distribution: SE = (b) We want to calculate a 91% confidence interval for the difference between the gas mileages for the automatic transmission and the manual transmission cars. What is the critical t-score that we should use to build our confidence interval? tcritical (c) Calculate the margin of error, the lower bound, and the upper bound for the 91% confidence interval. Margin of…arrow_forwardWinter visitors are extremely important to the economy of Southwest Florida. Hotel occupancy is an often- reported measure of visitor volume and visitor activity. Hotel occupancy data for February in two consecutive years are as follows. Current Year Previous Year Оссирied Rexms 1470 1458 Total Rooms 1750 1800 a. Formulate the hypothesis test that can be used to determine if there has been an increase in the proportion of rooms occupied over the one-year period. b. What is the estimated proportion of hotel rooms occupied each year? Using a 0.05 level of significance, what is your hypothesis test conclusion? What is the p-value? C. d. What is the 95% confidence interval estimate of the change in occupancy for the one-year period?arrow_forwardManova test A therapist interested in helping individuals with Ophidiophobia. In order to do this the therapist is going to slowly desensitize the patients to snakes. He needs to find a starting point so he presented a sample of 16 ophiophobes with snake related stimuli and measured their physiologic response on a scale of (1-20) Subject Picture of a snake plastic toy snake rubber life like snake 1 7 12 14 2 5 8 13 3 3 10 12 4 8 12 14 5 2 7 12 6 4 4 10 7 3 16 8 8 4 9 13 9 5 10 16 10 4 9 12 11 5 11 15 12 6 13 18 13 7 15 18 14 3 10 14 15 4 9 11 16 5 7 9 a. Conduct a one way manova test and interpret and analyse the results. Justify your answersarrow_forward
- Estriol Level and Birth Weight. J. Greene and J. Touchstone conducted a study on the relationship between the estriol levels of pregnant women and the birth weights of their children. Their findings, “Urinary Tract Estriol: An Index of Placental Function,” were published in the American Journal of Obstetrics and Gynecology (Vol. 85(1), pp. 1–9). The data from the study are provided on the WeissStats site, where estriol levels are in mg/24 hr and birth weights are in hectograms. a. Decide whether finding a regression line for the data is reasonable. If so, then also do parts (b)–(d). b. Obtain the coefficient of determination. c. Determine the percentage of variation in the observed values of the response variable explained by the regression, and interpret your answer. d. State how useful the regression equation appears to be for making predictions.arrow_forwardRetinitis pigmentosa (RP) is a hereditary ocular diseasein which patches of pigment appear on the retina, potentially resulting in substantial vision loss and in somecases complete blindness. An important issue is how fastthe subjects decline. Visual field is an important measureof area of vision, which is measured in degree2. A visualfield area for a normal person is around 11,000 degree2.The longitudinal data in Table 11.29 were provided by anindividual patient.Table 11.29 Longitudinal visual field data forone RP patientTime Visual field area lnVisit (yr) (degree2) (visual field area)1 0 3059 8.032 1 3053 8.023 2 1418 7.264 3 1692 7.435 4 1978 7.596 5 1567 7.367 6 1919 7.568 7 1998 7.609 11 1648 7.4110 13 1721 7.4511 15 1264 7.14mean 6.09 1938 7.532sd 4.97 597 0.280Suppose the rate of change of ln (visual field) is a linearfunction of follow-up time.11.103 Write down a linear regression model that summarizes this relationship.11.104 Fit the regression line using the method of…arrow_forwardRetinitis pigmentosa (RP) is a hereditary ocular diseasein which patches of pigment appear on the retina, potentially resulting in substantial vision loss and in somecases complete blindness. An important issue is how fastthe subjects decline. Visual field is an important measureof area of vision, which is measured in degree2. A visualfield area for a normal person is around 11,000 degree2.The longitudinal data in Table 11.29 were provided by anindividual patient.Table 11.29 Longitudinal visual field data forone RP patientTime Visual field area lnVisit (yr) (degree2) (visual field area)1 0 3059 8.032 1 3053 8.023 2 1418 7.264 3 1692 7.435 4 1978 7.596 5 1567 7.367 6 1919 7.568 7 1998 7.609 11 1648 7.4110 13 1721 7.4511 15 1264 7.14mean 6.09 1938 7.532sd 4.97 597 0.280Suppose the rate of change of ln (visual field) is a linearfunction of follow-up time.11.103 Write down a linear regression model that summarizes this relationship.arrow_forward
- Sulfur compounds cause "off-odors" in wine, and winemakers want to know the odor threshold – the lowest concentration of a compound that the human nose can detect. The odor threshold for dimethyl sulfide (DMS) in trained wine tasters is about 25 micrograms per liter of wine (µg/L). The untrained noses of consumers may be less sensitive, however. A set of DMS odor threshold data for 10 untrained students was analyzed. How sensitive are the untrained noses of students? You want to estimate the mean DMS odor threshold among all students, and you would be satisfied to estimate the mean to within ±0.25 with 95% confidence. The standard deviation of the odor threshold for untrained noses is known to be o = 8 micrograms per liter of wine. How large an SRS of untrained students do you need? Give your answer rounded up to the nearest whole number. n = Incorrectarrow_forwardGood Morning, I am needing assistance making the changes the instructor requested be changed on this question. Thank you. Scenario:Is there a relationship between one’s gender and whether one owns a dog, cat, or reptile? Use the data provided in the table below to answer the following questions. Question: Using the degrees of freedom provided by your SPSS output and an alpha value of .05, find the critical value in the appropriate table in the Appendix of your Jackson e-book. Do not round – present all three decimal places. Clearly identify the critical value from your e-book and the obtained value from your SPSS output. Based on this information, would you reject or fail to reject the null hypothesis? Does this mean there is a significant difference or no significant difference? My Answer: The chi-square test of significance between the gender and pets owned is shown. The findings indicate that, with a p-value of 0.177, which is higher than the alpha value, there was no…arrow_forwardFifty male subjects drank a measured amount x (in ounces) of a medication and the concentration y (in percent) in their blood of the active ingredient was measured 30 minutes later. The sample data are summarized by the following information: n = 50 Ex = 112.5 Ex? = 356.25 %3D Ey = 4.83 Ey = 0.667 Exy = 15.255 0 < x < 4.5 Or= 0.875 Or= 0.709 Or= -0.846 Or=0.460 Or= 0.965arrow_forward
arrow_back_ios
SEE MORE QUESTIONS
arrow_forward_ios
Recommended textbooks for you
 Glencoe Algebra 1, Student Edition, 9780079039897...AlgebraISBN:9780079039897Author:CarterPublisher:McGraw Hill
Glencoe Algebra 1, Student Edition, 9780079039897...
Algebra
ISBN:9780079039897
Author:Carter
Publisher:McGraw Hill
Hypothesis Testing using Confidence Interval Approach; Author: BUM2413 Applied Statistics UMP;https://www.youtube.com/watch?v=Hq1l3e9pLyY;License: Standard YouTube License, CC-BY
Hypothesis Testing - Difference of Two Means - Student's -Distribution & Normal Distribution; Author: The Organic Chemistry Tutor;https://www.youtube.com/watch?v=UcZwyzwWU7o;License: Standard Youtube License