
Excursions In Modern Mathematics, 9th Edition
9th Edition
ISBN: 9780134494142
Author: Tannenbaum
Publisher: PEARSON
expand_more
expand_more
format_list_bulleted
Concept explainers
Videos
Textbook Question
Chapter 9, Problem 64E
Each of the line graph shown in Figs. 9-19 through 9-24 describes a population that grows according to a linear, an exponential, or a logistic model. For each line graph, determine which model applies.
a.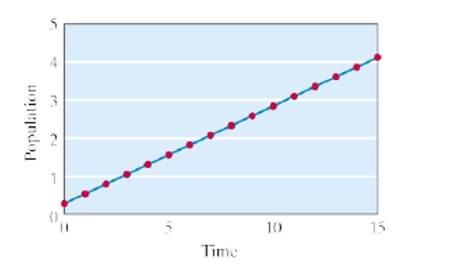
Figure 9-19
b.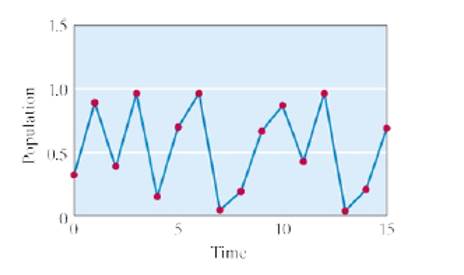
Figure 9-20
c.
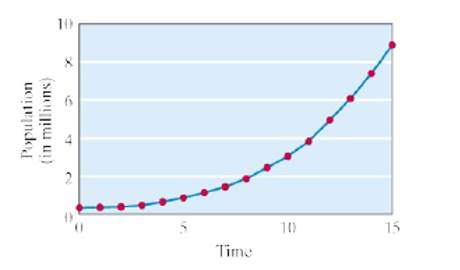
Figure 9-21
d.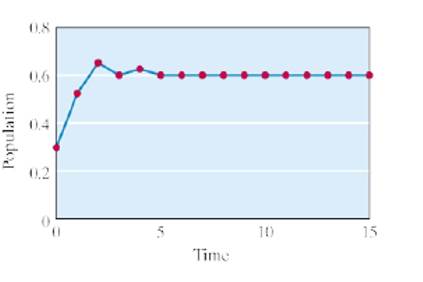
Figure 9-22
e.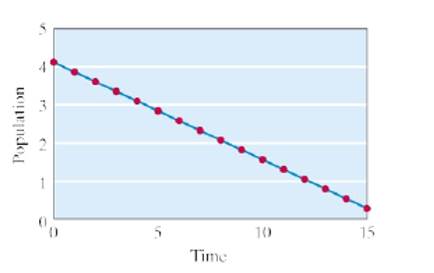
Figure 9-23
f.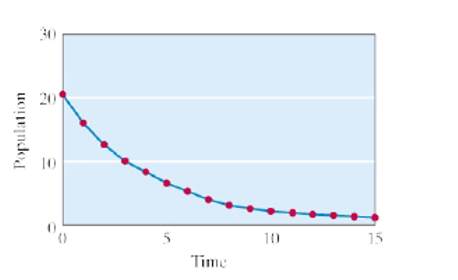
Figure 9-24
Expert Solution & Answer
Want to see the full answer?
Check out a sample textbook solution
Chapter 9 Solutions
Excursions In Modern Mathematics, 9th Edition
Ch. 9 - Consider the sequence defined by the explicit...Ch. 9 - Consider the sequence defined by the explicit...Ch. 9 - Consider the sequence defined by the explicit...Ch. 9 - Consider the sequence defined by the explicit...Ch. 9 - Consider the sequence defined by the explicit...Ch. 9 - Consider the sequence defined by the explicit...Ch. 9 - Consider the sequence defined by the explicit...Ch. 9 - Consider the sequence defined by the explicit...Ch. 9 - Consider the sequence defined by the explicit...Ch. 9 - Consider the sequence 1,4,9,16,25,.... a. List the...
Ch. 9 - Consider the sequence 1,2,6,24,120,.... a. List...Ch. 9 - Consider the sequence 0,1,3,6,10,15,21.... a. List...Ch. 9 - Prob. 14ECh. 9 - Consider the sequence 1,85,2,167,208,.... a. List...Ch. 9 - Prob. 16ECh. 9 - Airlines would like to board passengers in the...Ch. 9 - When two fair coins are tossed the probability of...Ch. 9 - Consider a population that grows linearly...Ch. 9 - Consider a population that grows linearly...Ch. 9 - Consider a population that grows linearly...Ch. 9 - Consider a population that grows linearly...Ch. 9 - Consider a population that grows linearly, with...Ch. 9 - Consider a population that grows linearly, with...Ch. 9 - Official unemployment rates for the U.S....Ch. 9 - The world population reached 6 billion people in...Ch. 9 - The Social Security Administration uses a linear...Ch. 9 - While the number of smokers for the general adult...Ch. 9 - Use the arithmetic sum formula to find the sum...Ch. 9 - Prob. 30ECh. 9 - An arithmetic sequence has first term P0=12 and...Ch. 9 - An arithmetic sequence has first term P0=1 and...Ch. 9 - Find the sum a. 1+3+5+7++149.Hint: See Example...Ch. 9 - Find the sum a. 2+4+6++98. b. 2+4+6+75terms.Ch. 9 - The city of Lightsville currently has 137...Ch. 9 - Prob. 36ECh. 9 - A population grows according to an exponential...Ch. 9 - A population grows according to an exponential...Ch. 9 - A population grows according to the recursive rule...Ch. 9 - Prob. 40ECh. 9 - Crime in Happyville is on the rise. Each year the...Ch. 9 - Prob. 42ECh. 9 - Prob. 43ECh. 9 - Avian influenza A H5N1 is a particularly virulent...Ch. 9 - In 2010 the undergraduate enrollment at Bright...Ch. 9 - In 2009 there were 73 cases of avian influenza A...Ch. 9 - Consider the geometric sequence P0=2, P1=6, P2=18,...Ch. 9 - Consider the geometric sequence P0=4, P1=6, P2=9,...Ch. 9 - Consider the geometric sequence P0=4, P1=2, P2=1,....Ch. 9 - Consider the geometric sequence P0=10, P1=2,...Ch. 9 - Find the sum a. 1+2+22+23++215. b. 1+2+22+23++2N1...Ch. 9 - Find the sum a. 1+3+32+33++310. b. 1+3+32+33++3N1....Ch. 9 - A population grows according to the logistic...Ch. 9 - A population grows according to the logistic...Ch. 9 - For the population discussed in Exercise 53...Ch. 9 - Prob. 56ECh. 9 - Prob. 57ECh. 9 - Prob. 58ECh. 9 - Prob. 59ECh. 9 - Prob. 60ECh. 9 - A population grows according to the logistic...Ch. 9 - A population grows according to the logistic...Ch. 9 - Each of the following sequences follows a linear,...Ch. 9 - Each of the line graph shown in Figs. 9-19 through...Ch. 9 - Prob. 65ECh. 9 - Prob. 66ECh. 9 - Prob. 67ECh. 9 - Prob. 68ECh. 9 - Prob. 69ECh. 9 - Prob. 70ECh. 9 - Prob. 71ECh. 9 - Prob. 72ECh. 9 - Prob. 73ECh. 9 - Prob. 74ECh. 9 - Prob. 75ECh. 9 - Show that if P0,P1,P2,... is an arithmetic...
Knowledge Booster


Learn more about
Need a deep-dive on the concept behind this application? Look no further. Learn more about this topic, subject and related others by exploring similar questions and additional content below.Similar questions
- Enter the data from Table 2 into a graphing calculator and graph the ranking scatter plot. Determine whetherthe data from the table would likely represent a function that is linear, exponential, or logarithmic.arrow_forwardTable 6 shows the year and the number ofpeople unemployed in a particular city for several years. Determine whether the trend appears linear. If so, and assuming the trend continues, in what year will the number of unemployed reach 5 people?arrow_forward
Recommended textbooks for you
 Algebra & Trigonometry with Analytic GeometryAlgebraISBN:9781133382119Author:SwokowskiPublisher:Cengage

 Trigonometry (MindTap Course List)TrigonometryISBN:9781337278461Author:Ron LarsonPublisher:Cengage Learning
 Calculus For The Life SciencesCalculusISBN:9780321964038Author:GREENWELL, Raymond N., RITCHEY, Nathan P., Lial, Margaret L.Publisher:Pearson Addison Wesley,
 Glencoe Algebra 1, Student Edition, 9780079039897...AlgebraISBN:9780079039897Author:CarterPublisher:McGraw Hill
Algebra & Trigonometry with Analytic Geometry
Algebra
ISBN:9781133382119
Author:Swokowski
Publisher:Cengage
Trigonometry (MindTap Course List)
Trigonometry
ISBN:9781337278461
Author:Ron Larson
Publisher:Cengage Learning
Calculus For The Life Sciences
Calculus
ISBN:9780321964038
Author:GREENWELL, Raymond N., RITCHEY, Nathan P., Lial, Margaret L.
Publisher:Pearson Addison Wesley,
Glencoe Algebra 1, Student Edition, 9780079039897...
Algebra
ISBN:9780079039897
Author:Carter
Publisher:McGraw Hill
Which is the best chart: Selecting among 14 types of charts Part II; Author: 365 Data Science;https://www.youtube.com/watch?v=qGaIB-bRn-A;License: Standard YouTube License, CC-BY