
Concept explainers
Videos
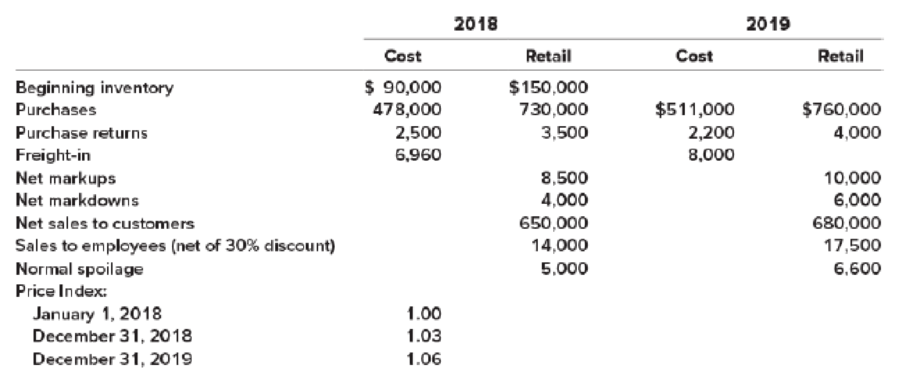
Retail inventory method; various applications
• LO9–3 through LO9–5
On January 1, 2018, Pet Friendly Stores adopted the retail inventory method. Inventory transactions at both cost and retail, and cost indexes for 2018 and 2019 are as follows:
Required:
- 1. Estimate the 2018 and 2019 ending inventory and cost of goods sold using the dollar-value LIFO retail method.
- 2. Estimate the 2018 ending inventory and cost of goods sold using the average cost retail method.
- 3. Estimate the 2018 ending inventory and cost of goods sold using the conventional retail method.
1.
Dollar-Value-LIFO
This method shows all the inventory figures at dollar price rather than units. Under this inventory method, the units that are purchased last, are sold first. Thus, it starts from the selling of the units recently purchased and ending with the beginning inventory.
To Estimate: the ending inventory and cost of goods sold in 2018 using dollar-value LIFO retail method.
Explanation of Solution
Calculate the amount of estimated ending inventory and cost of goods sold at retail.
| Details | Cost ($) | Retail ($) |
| Beginning inventory | 90,000 | 150,000 |
| Add: Net purchase | 478,000 | 730,000 |
| Freight-in | 6,960 | |
| Net markups | 8,500 | |
| Less: Net markdowns | (4,000) | |
| Purchase returns | (2,500) | (3,500) |
| Goods available for sale – Excluding beginning inventory | 482,460 | 731,000 |
| Goods available for sale – Including beginning inventory | 572,460 | 881,000 |
| Less: Normal spoilage | 0 | (5,000) |
| Net sales | (664,000) | |
| Employees discounts | (6,000) | |
| Estimated ending inventory at current year retail prices | 206,000 | |
| Estimated ending inventory at cost (Refer Table 2) | (123,990) | |
| Estimated Cost of Goods Sold | 448,470 |
Table (1)
Working Notes:
Calculate base layer cost-to retail percentage.
Calculate current year cost-to retail percentage.
Calculate the amount of estimated ending inventory at cost.
| Ending inventory at dollar-value LIFO retail cost | ||||
| Ending inventory at year-end retail prices ($) | Ending inventory at base year retail prices ($) | Inventory layers at base year retail prices ($) | Inventory layers converted to cost ($) | |
| 206,000 | 200,000 | 150,000 (Base) | 90,000 | |
| 50,000 (2018) | 33,990 | |||
| Total ending inventory at dollar-value LIFO retail cost | 123,990 | |||
Table (2)
Calculate the amount of ending inventory at base year retail prices.
Calculate the amount of inventory layers at base year retail prices.
Calculate the amount of inventory layers at current year retail prices.
Calculate the amount of inventory layers converted to cost (Base).
Calculate the amount of inventory layers converted to cost (2018).
Calculate the amount of estimated ending inventory and cost of goods sold at retail.
| Details | Cost ($) | Retail ($) |
| Beginning inventory | 123,990 | 206,000 |
| Add: Net purchase | 511,000 | 760,000 |
| Freight-in | 8,000 | |
| Net markups | 10,000 | |
| Less: Net markdowns | (6,000) | |
| Purchase returns | (2,200) | (4,000) |
| Goods available for sale – Excluding beginning inventory | 516,800 | 760,000 |
| Goods available for sale – Including beginning inventory | 640,790 | 966,000 |
| Less: Normal spoilage | 0 | (6,600) |
| Net sales | (697,500) | |
| Employees discounts | (7,500) | |
| Estimated ending inventory at current year retail prices | 254,400 | |
| Estimated ending inventory at cost (Refer Table 4) | (152,822) | |
| Estimated Cost of Goods Sold | 487,968 |
Table (3)
Working Notes:
Calculate base layer cost-to retail percentage.
Calculate 2018 year cost-to retail percentage.
Calculate current year cost-to retail percentage.
Calculate the amount of estimated ending inventory at cost.
| Ending inventory at dollar-value LIFO retail cost | ||||
| Ending inventory at year-end retail prices ($) | Ending inventory at base year retail prices ($) | Inventory layers at base year retail prices ($) | Inventory layers converted to cost ($) | |
| 254,400 | 240,000 | 150,000 (Base) | 90,000 | |
| 50,000 (2018) | 33,990 | |||
| 40,000 (2019) | 28,832 | |||
| Total ending inventory at dollar-value LIFO retail cost | 152,822 | |||
Table (4)
Calculate the amount of ending inventory at base year retail prices.
Calculate the amount of inventory layers at base year retail prices.
Calculate the amount of inventory layers at current year retail prices.
Calculate the amount of inventory layers converted to cost (Base).
Calculate the amount of inventory layers converted to cost (2018).
Calculate the amount of inventory layers converted to cost (2019).
2.
Average cost
It is amethod of determining the cost-to retail percentage for all the goods available for sale.
To Calculate: The amount of ending inventory and cost of goods sold.
Explanation of Solution
The following table shows the ending inventory and cost of goods sold.
| Details | Cost ($) | Retail ($) |
| Beginning inventory | 90,000 | 150,000 |
| Add: Net purchase | 478,000 | 730,000 |
| Freight-in | 6,960 | |
| Net markups | 8,500 | |
| Less: Purchase Returns | (2,500) | (3,500) |
| Net markdowns | (4,000) | |
| Goods available for sale | 572,460 | 881,000 |
| Less: Normal spoilage | (5,000) | |
| Net sales | (664,000) | |
| Employees discounts | (6,000) | |
| Estimated ending inventory at retail | 206,000 | |
| Estimated ending inventory at cost(1) | (133,859) | |
| Estimated Cost of Goods Sold | 438,601 |
Table (5)
Working Note:
Calculate cost-to-retail percentage.
Calculate the amount of estimated ending inventory at cost.
3.
Conventional Retail Method
Conventional retail method refers to the estimation of the lower of average cost or market by eliminating the markdowns from the calculation of the cost-to-retail percentage.
In this case, the cost-to-retail percentage will be determined by dividing the goods available for sale at cost by the goods available for at retail (excluding markdowns). Thus, the conventional retail method will always result in lower estimation of ending inventory when the markdowns exist.
To Calculate: The amount of ending inventory and cost of goods sold.
Explanation of Solution
The following table shows the ending inventory and cost of goods sold.
| Details | Cost ($) | Retail ($) |
| Beginning inventory | 90,000 | 150,000 |
| Add: Net purchase | 478,000 | 730,000 |
| Freight-in | 6,960 | |
| Net markups | 8,500 | |
| Less: Purchase Returns | (2,500) | (3,500) |
| Net markdowns | (4,000) | |
| Goods available for sale | 572,460 | 881,000 |
| Less: Normal spoilage | (5,000) | |
| Net sales | (664,000) | |
| Employees discounts | (6,000) | |
| Estimated ending inventory at retail | 206,000 | |
| Estimated ending inventory at cost(2) | (133,241) | |
| Estimated Cost of Goods Sold | 439,219 |
Table (6)
Working Note:
Calculate cost-to-retail percentage.
Calculate the amount of estimated ending inventory at cost.
Want to see more full solutions like this?
Chapter 9 Solutions
INTERMEDIATE ACCT.(LL)W/CONNECT ACCESS


- E8.12 (LO 3) (FIFO, LIFO, Average-Cost Inventory) Shania Twain Company was formed onDecember 1, 2019. The following information is available from Twain’s inventory records for Product BAP. Units Unit CostJanuary 1, 2020 (beginning inventory) 600 $ 8.00Purchases:January 5, 2020 1,200 9.00January 25, 2020 1,300 10.00February 16, 2020 800 11.00March 26, 2020 600 12.00 A physical inventory on March 31, 2020, shows 1,600 units on hand.InstructionsPrepare schedules to compute the ending inventory at March 31, 2020, under each of the following inventory methods.a. FIFO b. LIFO. c. Weighted-average (round unit costs to two decimal places)arrow_forwardNOTE: Please do as Part A: Periodic direct method and Part B: Perpetual Allowance methods. the direction is not the same as text book. P9.3 (LO 1) (LCNRV–Cost-of-Goods-Sold and Loss) Malone Company determined its ending inventory at cost and at LCNRV at December 31, 2020, December 31, 2021, and December 31, 2022, as shown below. Cost NRV 12/31/20 $650,000 $650,000 12/31/21 780,000 712,000 12/31/22 905,000 830,000 Instructions a. Prepare the journal entries required at December 31, 2021, and at December 31, 2022, assuming that a perpetual inventory system and the cost-of-goods-sold method of adjusting to LCNRV is used. b. Prepare the journal entries required at December 31, 2021, and at December 31, 2022, assuming that a perpetual inventory is recorded at cost and reduced to LCNRV using the loss method.arrow_forwardMa4. Question 42. The cost of inventory that has been sold to customers is called: A. cost of goods sold, and it appears on the income statement. B.inventory, a current asset that appears on the balance sheet. C.inventory, a current asset that appears on the income statement. D.cost of goods sold, and it appears on the balance sheet. Question 43. ABC Company sold $120,000 of goods and accepted the customer's $120,000 10%, 1- year note in exchange. Assuming 10% approximates the market rate of return, how much interest would be recorded for the year ending December 31 if the sale was made on June 30? A.12,000 B. 3,000 C.0 D. 6,000 Question 44 Under the allowance method of recognizing uncollectible accounts, the entry to write off an uncollectible account A.increases the allowance for uncollectible accounts. B.has no effect on the allowance for uncollectible accounts. C.decreases net income. D. has no effect on net income.arrow_forward
- BUS 038 : Business Computations13 Which type of discount (trade discount or cash discount) is given as an incentive to pay the seller promptly? 14. Series discounts are a form of trade discount. (T or F) For Problems 15-19 assume that you purchase goods with a list price of $455 and a trade discount of 25%. The invoice is dated October 3 with terms of 3/15, n/45. 15. What is the net price after trade discount?arrow_forward(Appendix 8.1) Inventory Write-Down Frost Companys inventory records tor the years 2019 and 2020 reveal the cost and market of the January 1, 2019, inventory to be 125,000. On December 31, 2019, the cost of inventory was 130,000, while the market value was only 128,000. The December 31, 2020, market value of inventory was 140,000, and the cost was only 135,000. Frost uses a periodic inventory system. Purchases for 2019 were 100,000 and for 2020 were 110,000. Required: 1. Assume the inventory that existed at the end of 2019 was sold in 2020. Prepare the journal entries at the end of 2019 and 2020 to record the lower of cost or net realizable value under the (a) allowance method and (b) direct method. 2. Prepare the cost of goods sold section of the income statement and show how the company would record the inventory on its balance sheet for 2019 and 2020 under the (a) allowance method and (b) direct method. 3. Next Level Refer to your answer for P8-3. How does the use of a periodic inventory system versus a perpetual inventory system affect the valuation of inventory and the amount reported as income?arrow_forwardCA8.1 (LO 2) (Inventoriable Goods and Costs) You are asked to travel to Milwaukee to observe and verify the inventory of the Milwaukee branch of one of your clients. You arrive on Thursday, December 30, and find that the inventory procedures have just been started. You spot a railway car on the sidetrack at the unloading door and ask the warehouse superintendent, Buck Rogers, how he plans to inventory the contents of the car. He responds, “We are not going to include the contents in the inventory.” Later in the day, you ask the bookkeeper for the invoice on the carload and the related freight bill. The invoice lists the various items, prices, and extensions of the goods in the car. You note that the carload was shipped December 24 from Albuquerque, f.o.b. Albuquerque, and that the total invoice price of the goods in the car was $35,300. The freight bill called for a payment of $1,500. Terms were net 30 days. The bookkeeper affirms the fact that this invoice is to be held for recording…arrow_forward
- HW Q 4 Current Attempt in Progress At the end of Bridgeport Department Store’s fiscal year on November 30, 2020, these accounts appeared in its adjusted trial balance. Freight-In $ 7,500 Inventory 39,400 Purchases 578,500 Purchase Discounts 6,600 Purchase Returns and Allowances 2,900 Sales Revenue 1,044,700 Sales Returns and Allowances 17,000 Additional facts: 1. Merchandise inventory on November 30, 2020, is $ 53,800. 2. Bridgeport Department Store uses a periodic system. Prepare an income statement through gross profit for the year ended November 30, 2020. (Enter negative amounts using either a negative sign preceding the number e.g. -45 or parentheses e.g. (45).) BRIDGEPORT DEPARTMENT STOREIncome Statement (Partial)choose the accounting period select an opening name for section one enter an income statement item $ enter a dollar amount…arrow_forward(i) Inventory = (60.83 – 54.75) ´ $32,876.7123 = $199,890.41. (ii) Receivables = (73 – 65.70) ´ $41,095.8904 = $300,000. (iii) Payables = (33.46 – 30.42) ´ $32,876.7123 = $99,945.21 How did you compute the $32,876.7123 for inventory, $41,095.8904 for receivables, and $32,876.7123 for payables?arrow_forwardEA5. EA5. LO 10.2Akira Company had the following transactions for the month.Chart showing Beginning Inventory of 150 units at $10 per unit, Purchase of March 31 of 160 units at $12 each, Purchase of October 15 of 130 units at $15 each, and ending inventory of 50 units at a cost of ? each.Calculate the ending inventory dollar value for the period for each of the following cost allocation methods, using periodic inventory updating. Provide your calculations. first-in, first-out (FIFO)last-in, first-out (LIFO)weighted average (AVG)arrow_forward
- 8–6 Various inventory costing methods; gross profit ratio ● LO8–1, LO8–4, LO8–7 Topanga Group began operations early in 2024. Inventory purchase information for the quarter ended March 31, 2024, for Topanga’s only product is provided below. The unit costs include the cost of freight. The company uses a periodic inventory system to report inventory and cost of goods sold. Date of Purchase Units Unit Cost Total Cost Jan. 7 5,000 $4.00 $20,000 Feb. 16 12,000 4.50 54,000 March 22 17,000 5.00 85,000 Total purchases 34,000 $159,000 Sales for the quarter, all at $7.00 per unit, totaled 20,000 units leaving 14,000 units on hand at the end of the quarter. Required: Calculate Topanga’s gross profit ratio for the first quarter using: FIFO LIFO Average cost Comment on the relative effect of each of the three inventory methods on the gross profit ratio.arrow_forwardExercise 6-13 Estimating ending inventory-retail method LO6During 2023, Harmony Co. sold $525,000 of merchandise at marked retail prices. At the end of 2023, the following information wasavailable from its records:Beginning inventoryNet purchasesAt Cost At Retail$132,600 $261,800236,240 398,600Use the retail method to estimate Harmony's 2023 ending inventory at cost. (Round your intermediate and final answers to 2decimal places.)Ending inventoryarrow_forward55.XXX Company uses the average cost retail method to estimate its inventory. Data relating to the inventory at December 31, 2020 are: Cost Retail Inventory, January 1 P 2,000,000 P3,000,000 Purchases 10,600,000 14,000,000 Net markups 1,600,000 Net markdowns 600,000 Sales 12,000,000 Estimated normal shoplifting losses 400,000 Estimated normal shrinkage is 5% of sales Trinidad’s cost of goods sold for the year ended December 31, 2019 isarrow_forward
 Intermediate Accounting: Reporting And AnalysisAccountingISBN:9781337788281Author:James M. Wahlen, Jefferson P. Jones, Donald PagachPublisher:Cengage Learning