
Explanation:
Figure 1 illustrates the impact of world price and domestic price that creates trade diversification and creation.
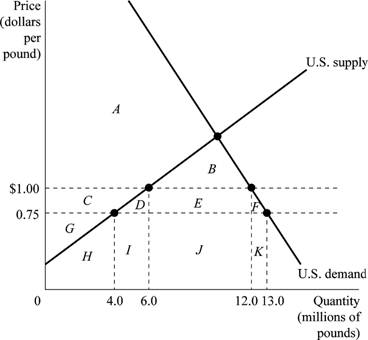
Figure 1
Figure 1 depicts the demand and supply of kumquats in the U.S. market after the quota restriction is imposed. Horizontal axis represents the quantity of kumquats in millions of pounds and the vertical axis represents the price in dollars per pound. The U.S. government imposes a quota of import of 6 million pounds of kumquats to the U.S. each year.
Using Figure 1, Table 1 is filled as follows:
Table 1
| Without Quota | With Quota | |
| World price of kumquats | $0.75 | $0.75 |
| U.S. price of kumquats | $0.75 | $1.00 |
| Quantity supplied by U.S. firms | 4 million | 6 million |
| Quantity demanded | 13 million | 12 million |
| Quantity imported | 9 million | 6 million |
| Area of consumer surplus | A + B + C + D + E + F | A + B |
| Area of domestic producer surplus | G | C + G |
| Area of deadweight loss | No deadweight loss | D + F |
When there is no quota, the quantity demanded is 13 million pounds of kumquats; out of which 4 million pounds is supplied by U.S. firms and rest 9 million pounds of kumquats
Consumer surplus is calculated as the area below the demand curve and above the market price. So, area of consumer surplus without quota is between market price of $0.75 and the demand curve, which is the sum of the areas A, B, C, D, E and F. The producer’s surplus is between U.S supply curve (above) and market price (below), which is the area G. With quota, consumer surplus is between price $1 and U.S demand curve, which is the sum of areas A and B, and the producer’s surplus which is increased by quota is the sum of areas C and G. There is no deadweight loss, if quotas are not imposed. With quota areas D and F denote the deadweight loss.
Concept introduction:
Quota: It is the numerical limit that a government imposes on the quantity of goods that can be imported into a country.
Consumer surplus: It is the monetary gain attained by a consumer, which is calculated as the difference between the price a consumer pays for the product and the price he would be willing to pay rather than do without it.
Producer surplus: It is the benefit attained by a producer by selling a product, which is calculated as the difference between the amount that a producer is willing to supply goods for and the actual amount received by him, when he makes the trade.
Measuring the economic effects of a quota.
Want to see the full answer?
Check out a sample textbook solution
Chapter 9 Solutions
Economics (7th Edition) (What's New in Economics)

- From the Work It Out Effects of Trade Barriers, you can see that a tariff raises the price of imports. What is interesting is that the price rises by less than the amount of the tariff. Who pays the rest of the tariff amount? Can you show this graphically?arrow_forwardShow graphically that for any tariff, there is an equivalent quota that would give the same result. What would be the difference, then, between the two types of trade barriers? Hint: It is not something you can see from the graph.arrow_forwardTrade has income distribution effects. For example, suppose that because of a government-negotiated reduction in trade barriers, trade between Germany and the Czech Republic increases. Germany sells house paint to the Czech Republic. The Czech Republic sells alarm clocks to Germany. Would you expect this pattern of trade to increase or decrease jobs and wages in the paint industry in Germany? The alarm clock industry in Germany? The paint industry in Czech Republic? The alarm clock industry in Czech Republic? What has to happen for there to be no increase in total unemployment in both countries?arrow_forward


 Economics (MindTap Course List)EconomicsISBN:9781337617383Author:Roger A. ArnoldPublisher:Cengage Learning
 Brief Principles of Macroeconomics (MindTap Cours...EconomicsISBN:9781337091985Author:N. Gregory MankiwPublisher:Cengage Learning
 Principles of Macroeconomics (MindTap Course List)EconomicsISBN:9781285165912Author:N. Gregory MankiwPublisher:Cengage Learning
 Principles of Economics, 7th Edition (MindTap Cou...EconomicsISBN:9781285165875Author:N. Gregory MankiwPublisher:Cengage Learning