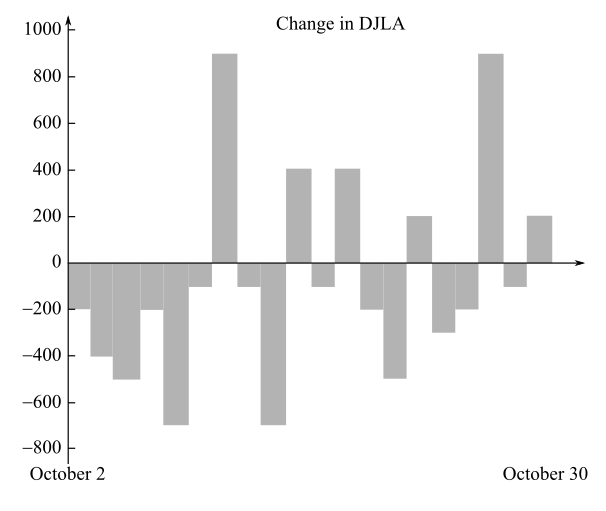
The values of X , if X is the (rounded) change in the Dow on a randomly selected day where the chart shows the day-by-day change, rounded to the nearest 100 points, in the Dow Jones Industrial Average during 20 successive business days around the start of the financial crisis in October 2008 .
The values of X , if X is the (rounded) change in the Dow on a randomly selected day where the chart shows the day-by-day change, rounded to the nearest 100 points, in the Dow Jones Industrial Average during 20 successive business days around the start of the financial crisis in October 2008 .
Solution Summary: The author explains how to determine the values of X, if it is the (rounded) change in the Dow on a randomly selected day.
The values of X, if X is the (rounded) change in the Dow on a randomly selected day where the chart shows the day-by-day change, rounded to the nearest 100 points, in the Dow Jones Industrial Average during 20 successive business days around the start of the financial crisis in October 2008.
(b)
To determine
To calculate: The frequency and probability distributions of X if X is the (rounded) change in the Dow on a randomly selected day where the chart shows the day-by-day change, rounded to the nearest 100 points, in the Dow Jones Industrial Average during 20 successive business days around the start of the financial crisis in October 2008.
(c)
To determine
To calculate: The probability that on a randomly selected day, the Dow decreased by more than 250 points if X is the (rounded) change in the Dow on a randomly selected day where the chart shows the day-by-day change, rounded to the nearest 100 points, in the Dow Jones Industrial Average during 20 successive business days around the start of the financial crisis in October 2008.
Need a deep-dive on the concept behind this application? Look no further. Learn more about this topic, calculus and related others by exploring similar questions and additional content below.