
Concept explainers
Videos
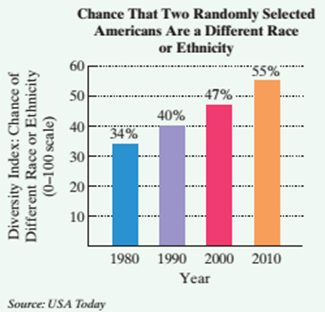
Diversity Index.
What is the chance that the next person I meet will be different from me? The diversity index, from 0 (no diversity) to 100, measures the chance that two randomly selected people are a different race or ethnicity. The diversity index in the United States varies widely from region to region, from as high as 81 in Hawaii to as low as 11 in Vermont. The bar graph shows the national diversity index for the United States for four years in the period from 1980 through 2010. Exercises 53−54 are based on the data in the graph.
53. The data in the graph can be modeled by the formula
a. How well does the formula model the national diversity index for 2010?
b. Use an inequality to determine in which years the national diversity index will exceed 62.
Want to see the full answer?
Check out a sample textbook solution
Chapter 9 Solutions
Introductory and Intermediate Algebra for College Students, Books a la Carte Edition PLUS MyLab Math (5th Edition)


 Glencoe Algebra 1, Student Edition, 9780079039897...AlgebraISBN:9780079039897Author:CarterPublisher:McGraw Hill
 Holt Mcdougal Larson Pre-algebra: Student Edition...AlgebraISBN:9780547587776Author:HOLT MCDOUGALPublisher:HOLT MCDOUGAL