
Concept explainers
Videos
The article “Most Dog Owners Take More Pictures of Their Pet Than Their Spouse” (August 22, 2016, news.fastcompany.com/most-dog-owners-take-more-pictures-of-their-pet-than-theirspouse-4017458, retrieved May 6, 2017) indicates that in a sample of 1000 dog owners, 650 said that they take more pictures of their dog than their significant others or friends. In addition, 460 said that they are more likely to complain to their dog than to a friend. Suppose that it is reasonable to consider this sample as representative of the population of dog owners.
- a. Construct and interpret a 90% confidence interval for the proportion of dog owners who take more pictures of their dog than of their significant others or friends.
- b. Construct and interpret a 95% confidence interval for the proportion of dog owners who are more likely to complain to their dog than to a friend.
- c. Give two reasons why the confidence interval in Part (b) is wider than the interval in Part (a).
a.
Find the 90% confidence interval for the proportion of dog owners who take more pictures of their dog than of their significant others or friends, and interpret it.
Answer to Problem 21E
The 90% confidence interval for the proportion of dog owners who take more pictures of their dog than of their significant others or friends is (0.625, 0.675).
Interpretation of confidence interval is, “One can be 90% confident that the proportion of dog owners who take more pictures of their dog than of their significant others or friends, is between 0.625 and 0.675”.
Explanation of Solution
Calculation:
It was found that 650 of the dog owners take more pictures of their dog than their significant others or friends in a sample of 1,000 dog owners. Also, 460 dog owners responded that they are more likely to complain to their dog than to a friend. It is assumed that the sample is a representative of the population of dog owners.
The confidence interval for a population proportion p is appropriate when,
- The sample size is large. That is, when
- The sample size is small relative to the population size. That is, the sample size should not be more than 10% of the population size.
- The sampling method is simple random sampling.
Then, the general formula for finding the confidence interval for a population proportion p is,
The dog owners who take more pictures of their dog than of their significant others or friends is 650 out of 1,000 dog owners. That is, sample proportion is 0.65
Check conditions:
Substitute
Since, both the conditions are satisfied, the sample is large enough which makes the confidence interval appropriate.
The population considered is of the dog owners. A sample of 1,000 dog owners is selected for the survey. Since the population considered is large, the sample size will be smaller than 10% of the population size.
Also, it is assumed that the sample is a representative of the population. Thus, it is reasonable to consider the sample as a random sample from the population.
The 90% confidence interval for proportion is calculated as follows:
Software procedure:
Step-by-step procedure to obtain the confidence interval using MINITAB software is given below:
- Choose Stat > Basic statistics>1-Sample proportion.
- In Summarized data, enter Number of events as 650 and Number of trials as 1,000.
- Check Options, enter Confidence level as 90.
- Choose not equal in alternative hypothesis.
- In method select Normal Approximation.
- Click OK in all dialogue boxes.
The output using the MINITAB software is given below:
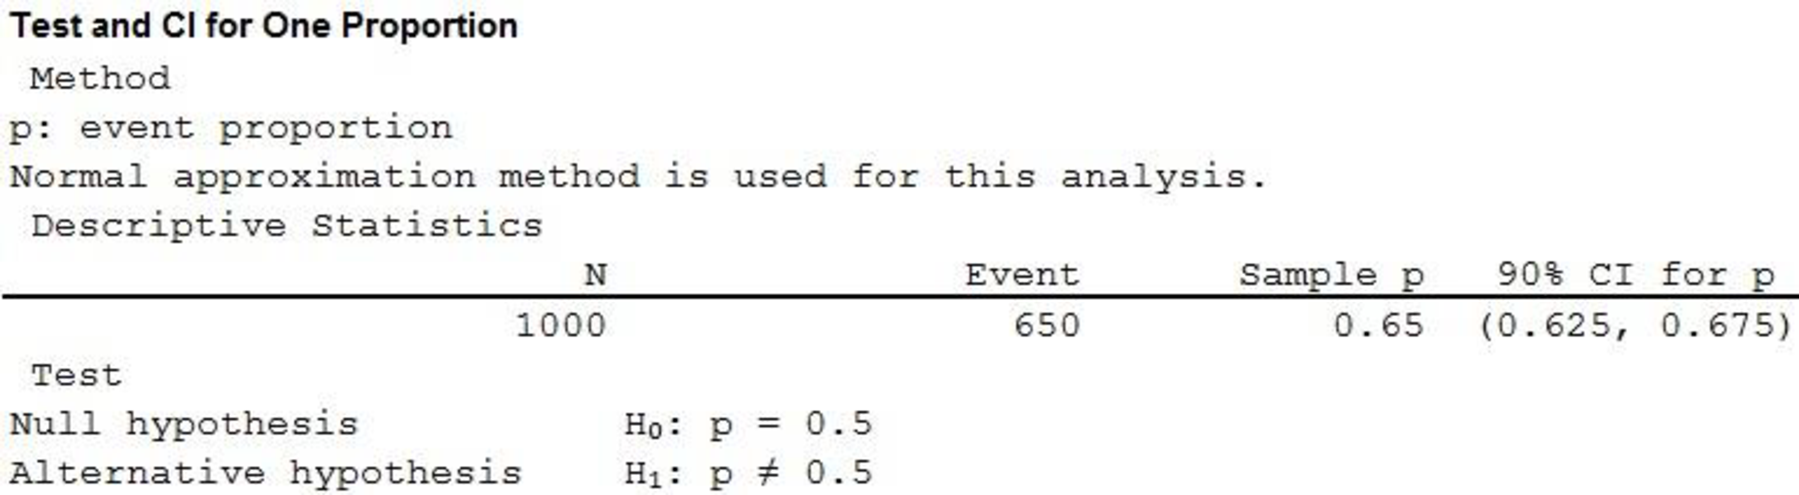
From the MINITAB output, the confidence interval is (0.625, 0.675).
Thus, the 90% confidence interval for the proportion of dog owners who take more pictures of their dog than of their significant others or friends is (0.625, 0.675).
Interpretation of confidence interval is “One can be 90% confident that the proportion of dog owners who take more pictures of their dog than of their significant others or friends is between 0.625 and 0.675”.
b.
Find the 95% confidence interval for the proportion of dog owners who are more likely to complain to their dog than to a friend, and interpret it.
Answer to Problem 21E
The 95% confidence interval for the proportion of dog owners who are more likely to complain to their dog than to a friend is (0.429, 0.491).
Interpretation of confidence interval is “One can be 95% confident that the proportion of dog owners who are more likely to complain to their dog than to a friend is between 0.429 and 0.491”.
Explanation of Solution
Calculation:
The dog owners who are more likely to complain to their dog than to a friend is 460 out of 1,000 dog owners. That is, sample proportion is 0.460
Check conditions:
Substitute
Since, both the conditions are satisfied, the sample is large enough which makes the confidence interval appropriate.
The population considered is of the dog owners. A sample of 1,000 dog owners is selected for the survey. Since the population considered is large, the sample size will be smaller than 10% of the population size.
Also, it is assumed that the sample is a representative of the population. Thus, it is reasonable to consider the sample as a random sample from the population.
The 95% confidence interval for proportion is calculated below:
Software procedure:
Step-by-step procedure to obtain the confidence interval using MINITAB software is given below:
- Choose Stat > Basic statistics>1-Sample proportion.
- In Summarized data, enter Number of events as 460 and Number of trials as 1,000.
- Check Options, enter Confidence level as 95.
- Choose not equal in alternative hypothesis.
- In method select Normal Approximation.
- Click OK in all dialogue boxes.
The output using the MINITAB software is given below:
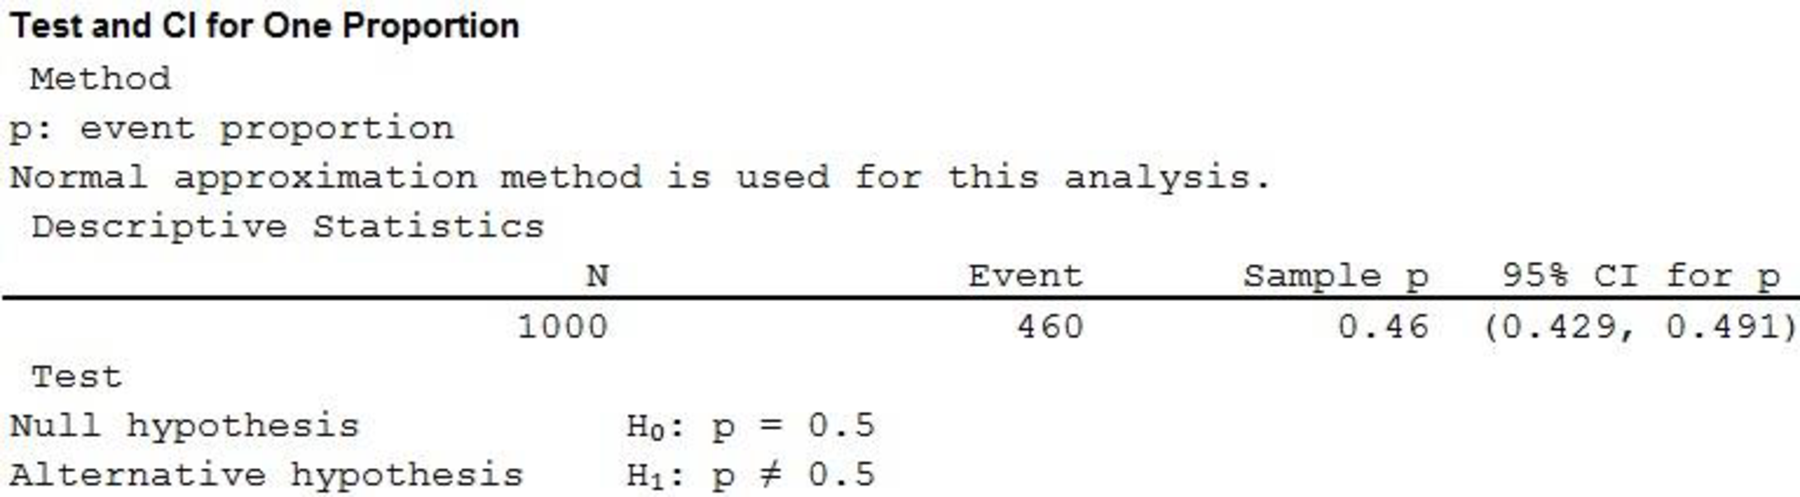
From the MINITAB output, the confidence interval is (0.429, 0.491).
Thus, the 95% confidence interval for the proportion of dog owners who are more likely to complain to their dog than to a friend is (0.429, 0.491).
Interpretation of confidence interval is “One can be 95% confident that the proportion of dog owners who are more likely to complain to their dog than to a friend is between 0.429 and 0.491”.
c.
Explain how the 95% confidence interval in part (b) is wider than a 90% confidence interval in part (a).
Explanation of Solution
As the confidence level increases, the width of the confidence interval increases. A 90% confidence level means that in the long run 90% of the time, the interval contains the true value of the population proportion p. As the confidence level increases, the chance of interval to contain the true value also increases.
The z critical value is smaller for a 90% confidence level than a 95% confidence level. Also, as the confidence level increases, the margin of error increases and the difference from the sample proportion also increases which makes the confidence interval wider. That is, as the confidence level increases, the width of the confidence interval also increases. Thus, the 95% confidence interval in part (b) is wider than a 90% confidence interval in part (a).
Want to see more full solutions like this?
Chapter 9 Solutions
Introduction To Statistics And Data Analysis


- What is a sample space?arrow_forwardShow that the probability of drawing a club at random from a standard deck of 52 playing cards is the same as the probability of drawing the ace of hearts at random from a set of four cards consisting of the aces of hearts, diamonds, clubs, and spades.arrow_forward
 Glencoe Algebra 1, Student Edition, 9780079039897...AlgebraISBN:9780079039897Author:CarterPublisher:McGraw Hill
 Holt Mcdougal Larson Pre-algebra: Student Edition...AlgebraISBN:9780547587776Author:HOLT MCDOUGALPublisher:HOLT MCDOUGAL