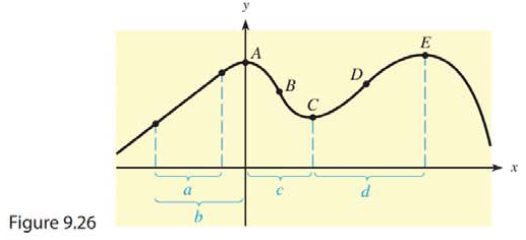
Because the derivative of a function represents both the slope of the tangent to the curve and the instantaneous rate of change of the function, it is possible to use information about one to gain information about the other. In Problems 31 and 32, use the graph of the function y = f ( x ) given in Figure 9.26. (a) At what point(s) A through E does the rate of change of f(x) change from positive to negative? (b) At what point(s) A through E does the rate of change of f(x) change from negative to positive?
Because the derivative of a function represents both the slope of the tangent to the curve and the instantaneous rate of change of the function, it is possible to use information about one to gain information about the other. In Problems 31 and 32, use the graph of the function y = f ( x ) given in Figure 9.26. (a) At what point(s) A through E does the rate of change of f(x) change from positive to negative? (b) At what point(s) A through E does the rate of change of f(x) change from negative to positive?
Solution Summary: The graph is given as Explanation: Instantaneous value and slope both are basically the derivatives of the function.
Because the derivative of a function represents both the slope of the tangent to the curve and the instantaneous rate of change of the function, it is possible to use information about one to gain information about the other. In Problems 31 and 32, use the graph of the function
y
=
f
(
x
)
given in Figure 9.26.
(a) At what point(s) A through E does the rate of change of f(x) change from positive to negative? (b) At what point(s) A through E does the rate of change of f(x) change from negative to positive?
WebAssign with Corequisite Support for Harshbarger/Reynolds/Karr/Massey's Mathematical Applications for the Management, Life, and Social Sciences, 12th Edition [Instant Access], Single-Term
Need a deep-dive on the concept behind this application? Look no further. Learn more about this topic, subject and related others by exploring similar questions and additional content below.
![WebAssign with Corequisite Support for Harshbarger/Reynolds/Karr/Massey's Mathematical Applications for the Management, Life, and Social Sciences, 12th Edition [Instant Access], Single-Term](https://s3.amazonaws.com/compass-isbn-assets/textbook_empty_images/large_textbook_empty.svg)


 Calculus For The Life SciencesCalculusISBN:9780321964038Author:GREENWELL, Raymond N., RITCHEY, Nathan P., Lial, Margaret L.Publisher:Pearson Addison Wesley,