
Videos
Two-Tailed Hypothesis Tests and CIs. The following relationship holds between hypothesis tests and confidence intervals for one-
- a. Exercise 9.113
- b. Exercise 9.116
9.113 TV Viewing. According to Communications Industry' Forecast & Report, published by Veronis Suhler Stevenson, the average person watched 4.55 hours of television per day in 2005. A random sample of 20 people gave the following number of hours of television watched per day for last year.
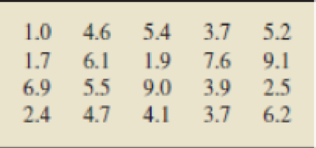
At the 10% significance level, do the data provide sufficient evidence to conclude that the amount of television watched per day
last year by the average person differed from that in 2005? (Note:  = 4.760 hours and s = 2.297 hours.)
9.116 Apparel and Services. According to the document Consumer Expenditures, a publication of the Bureau of Labor Statistics, the average consumer unit spent $1736 on apparel and services in 2012. That same year, 25 consumer units in the Northeast had the following annual expenditures, in dollars, on apparel and services.
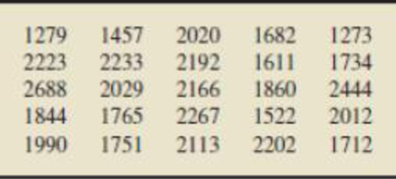
At the 5% significance level, do the data provide sufficient evidence to conclude that the 2012 mean annual expenditure on apparel and services for consumer units in the Northeast differed from the national mean of $17367? (Note: The sample mean and sample standard deviation of the data are $1922.76 and $350 90 respectively.)
Want to see the full answer?
Check out a sample textbook solution
Chapter 9 Solutions
Introductory Statistics, Books a la Carte Plus NEW MyLab Statistics with Pearson eText -- Access Card Package (10th Edition)


 Calculus For The Life SciencesCalculusISBN:9780321964038Author:GREENWELL, Raymond N., RITCHEY, Nathan P., Lial, Margaret L.Publisher:Pearson Addison Wesley,
 Glencoe Algebra 1, Student Edition, 9780079039897...AlgebraISBN:9780079039897Author:CarterPublisher:McGraw Hill