
Videos
The bar graph shows minimum legal ages for sex and marriage in five selected countries. Use this information to solve Exercises 41-42. (We did not include data for the United States because the legal age of sexualconsent vanes according to state law. Furthermore, women are allowed to marry younger than men 16 for womenand 18 for men.)
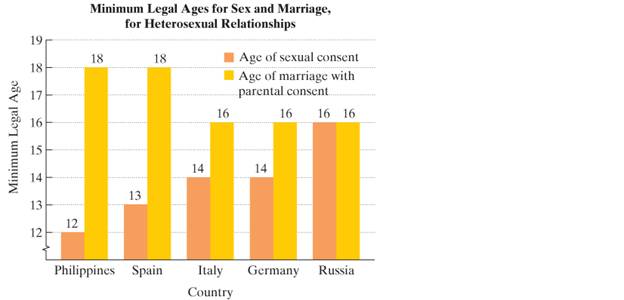
42. a. Write a set of live ordered pairs in which countries correspond to the minimum legal age of marriage with parental consent. Each ordered pair should be in the form(country, minimum legal age of marriage with parental constent).
b. Is the relation in part (a) a function? Explain your answer.
c. Write a set of five ordered pairs in which the minimum legal age of marriage with parental consentcorresponds to a country Each ordered pair should be in the form(minimum legal age of marriage with parental constent, country).
d. Is the relation in part (C) a function?
Want to see the full answer?
Check out a sample textbook solution
Chapter 9 Solutions
INTRODUCTORY ALGEBRA..-LEARN.GDE+MYMATH


- In 2011 the United States federal government decided that all businesses must pay their employees a minimum wage of $7.25 per hour. However, state governments could decide that businesses in their states should pay their employees more than the $7.25 per hour. Below is a graph of hourly minimum wage requirements for five states. Use the information provided in the graph to decide which of the following statements is NOT TRUE! New York's hourly wage requirement is about the same as the federal minimum wage requirement. The hourly wage in Ohio is more than $1 above the hourly wage in Minnesota. Oregon has the highest hourly wage requirement at over $8.00 per hour. The hourly wage in New York is more than double the hourly wage in Georgia.arrow_forwardGokul records historical data for gasoline prices to the nearest five cents in the graph and draws a line of best fit. Which statement is true? a) The line is not the line of best fit because it should pass through (1995, 1.15) and (2004, 1.75). b) The line is not the line of best fit because there could be a line drawn that would be closer to more points. c) The line is the line of best fit because it passes through points that are in the middle of the data set. d) The line is the line of best fit because half of the points are above the line and half of the points are below the line.arrow_forwardThe bar graph shows seven common excuses by college students for not meeting assignment deadlines. The bar heights represent the number of excuses for every 500 excuses that fall into each of these categories.For every 500 excuses, the number involving computer problems exceeds the number involving oversleeping by 10.The number involving illness exceeds the number involving oversleeping by 80. Combined, oversleeping, computer problems, and illness account for 270 excuses for not meeting assignment deadlines. For every 500 excuses, determine the number due to oversleeping, computer problems, and illness.arrow_forward
- Suisan fish company distributes fishes in Big Island and delivers them to warehouses, retail stores, and poke restaurants. The network diagram given in figure below shows the possible routes and distances from the various warehouses, retail stores, and restaurants to other places.arrow_forwardFind the centrality (closeness and betweenness) points.arrow_forward4. Handwritten need grapharrow_forward
 Holt Mcdougal Larson Pre-algebra: Student Edition...AlgebraISBN:9780547587776Author:HOLT MCDOUGALPublisher:HOLT MCDOUGAL
 Algebra: Structure And Method, Book 1AlgebraISBN:9780395977224Author:Richard G. Brown, Mary P. Dolciani, Robert H. Sorgenfrey, William L. ColePublisher:McDougal Littell