
Videos
The bar graph shows minimum legal ages for sex and marriage in five selected countries. Use this information to solve Exercises 41-42. (We did not include data for the United States because the legal age of sexualconsent vanes according to state law. Furthermore, women are allowed to marry younger than men 16 for womenand 18 for men.)
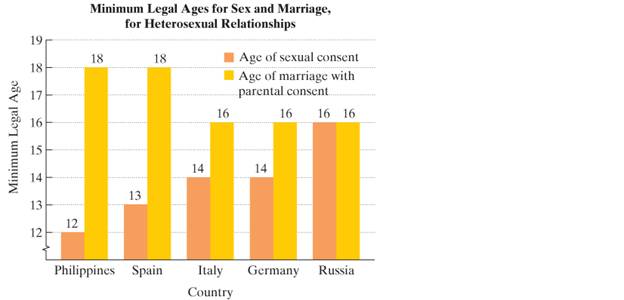
42. a. Write a set of live ordered pairs in which countries correspond to the minimum legal age of marriage with parental consent. Each ordered pair should be in the form(country, minimum legal age of marriage with parental constent).
b. Is the relation in part (a) a function? Explain your answer.
c. Write a set of five ordered pairs in which the minimum legal age of marriage with parental consentcorresponds to a country Each ordered pair should be in the form(minimum legal age of marriage with parental constent, country).
d. Is the relation in part (C) a function?
Want to see the full answer?
Check out a sample textbook solution
Chapter 9 Solutions
MyLab Math with Pearson eText -- 24 Month Standalone Access Card -- for Introductory Algebra for College Students with Integrated Review


- Name the four characteristics of a good definition.arrow_forwardAnswer the following questions. 5. What is the term for the arrangement that selects r objects from a set of ii objects when the order of the r objects is not important? What is the formula for calculating the number of possible outcomes for this type of arrangement?arrow_forwardIs it possible that P(AB)=P(A)? Explain.arrow_forward
- 3. A student received grades of 89, 85, 72, 92 and 75. What is the mode of the given grades?arrow_forwardtatcrunch 2 Refer to the accompanying data display that results from a sample of airport data speeds in Mbps. Complete parts (a) through (c) below. Click the icon to view at distribution table. W S X H d a. What is the number of degrees of freedom that should be used for finding the critical value t/2? df = 0 (Type a whole number.) b. Find the critical value t/2 corresponding to a 95% confidence level. ¹ x/2 = (Round to two decimal places as needed.) c. Give a brief general description of the number of degrees of freedom. Tech help # 3 OA. The number of degrees of freedom for a collection of sample data is the total number of sample values. OB. The number of degrees of freedom for a collection of sample data is the number of sample values that can vary after certain restrictions have been imposed on all data values. 20 E D с F3 $ 4 888 R F V % 5 T G F5 B MacBook Air Y H 8 7 N F7 TEE U J 00* 8 ►II M F8 9 K O L command F10 P { alt option (13.046,22.15) x=17.598 Sx=16.01712719 n=50 1 Next…arrow_forwardEach month interviewers visit about 63,000 of the 84 million households in the region and question the occupants over 14 years of age about their immigration status. Their responses enable the interviewers to estimate the percentage of people in the labor force who are illegal immigrants. Complete parts a through c. a. Define the population of interest to the interviewers. A. The 63,000 households visited in the region B. Immigration status C. All people in the region who are over 14 years old D. The 84 million households in the regionarrow_forward
- i need helparrow_forwardDraw the scatter diagram of “modules are remaining to complete the degree/diploma and number of hours spend on social media” by using EXCEL and give your interpretation.arrow_forward1.) Write a SAS program to read in the text file called adults. Run the program, print the data, and copy and paste your results as your answer.arrow_forward
- The boxplots show prices of used cars (in thousands of dollars) advertised for sale at three different car dealers. Which dealer has the smallest price range? a. Ace B. Cannot be determined C. BuyIt D. CarZarrow_forwardThe Current Results website lists the average annual high and low temperatures (degreesfahrenheit) and average annual snowfall (inches) for fifty-one major U.S. cities, based ondata from 1981 to 2010. The data are contained in the file Snow. for example, the average low temperature for Columbus, Ohio is 44 degrees and the average annual snowfallis 27.5 inches.a. Construct a scatter diagram with the average annual low temperature on the horizontalaxis and the average annual snowfall on the vertical axisarrow_forwardWhich of the following is a false statement? A. Ordinal data can be represented by numbers. B. Nominal data can be represented by numbers. C. Interval data can be used to group variables. D. Nominal data are strictly qualitative.arrow_forward

 Algebra: Structure And Method, Book 1AlgebraISBN:9780395977224Author:Richard G. Brown, Mary P. Dolciani, Robert H. Sorgenfrey, William L. ColePublisher:McDougal Littell
 Algebra & Trigonometry with Analytic GeometryAlgebraISBN:9781133382119Author:SwokowskiPublisher:Cengage
 Glencoe Algebra 1, Student Edition, 9780079039897...AlgebraISBN:9780079039897Author:CarterPublisher:McGraw Hill
 Holt Mcdougal Larson Pre-algebra: Student Edition...AlgebraISBN:9780547587776Author:HOLT MCDOUGALPublisher:HOLT MCDOUGAL
 Elementary Geometry For College Students, 7eGeometryISBN:9781337614085Author:Alexander, Daniel C.; Koeberlein, Geralyn M.Publisher:Cengage,