
Concept explainers
Videos
To find the best function that models the data and write its equation.
Answer to Problem 24PPE
The exponential function
Explanation of Solution
Given information:
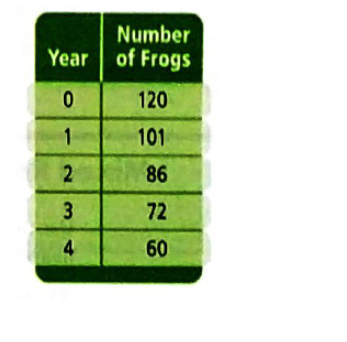
A conservation organization collected the data on the number of frogs in a local wetland as shown below:
Graph the data:
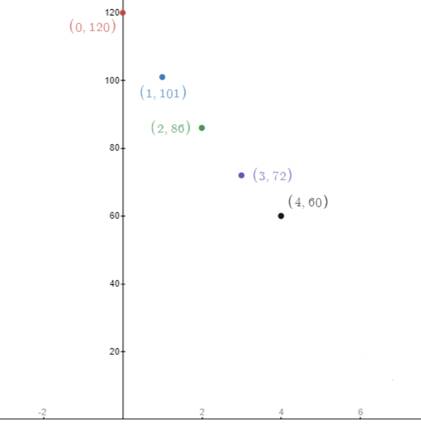
The graph seems to be exponential or quadratic.
Test for common ratio:
The y-values have a common ratio of
Write an exponential model:
The exponential model is given by
The graph passes through
Thus,
The graph also passes through
Therefore,
Hence, the exponential model is given by
Chapter 9 Solutions
High School Math 2015 Common Core Algebra 1 Student Edition Grade 8/9
Additional Math Textbook Solutions
Intermediate Algebra
Differential Equations and Linear Algebra (4th Edition)
College Algebra in Context with Applications for the Managerial, Life, and Social Sciences (5th Edition)
Elementary and Intermediate Algebra: Concepts and Applications (7th Edition)


 Algebra and Trigonometry (6th Edition)AlgebraISBN:9780134463216Author:Robert F. BlitzerPublisher:PEARSON
 Contemporary Abstract AlgebraAlgebraISBN:9781305657960Author:Joseph GallianPublisher:Cengage Learning
 Linear Algebra: A Modern IntroductionAlgebraISBN:9781285463247Author:David PoolePublisher:Cengage Learning
 Algebra And Trigonometry (11th Edition)AlgebraISBN:9780135163078Author:Michael SullivanPublisher:PEARSON
 Introduction to Linear Algebra, Fifth EditionAlgebraISBN:9780980232776Author:Gilbert StrangPublisher:Wellesley-Cambridge Press
 College Algebra (Collegiate Math)AlgebraISBN:9780077836344Author:Julie Miller, Donna GerkenPublisher:McGraw-Hill Education