Videos
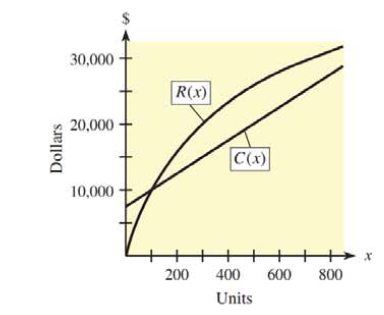
In each of Problems 29 and 30, the graphs of a company’s total revenue function and total cost function are shown. For each problem, use the graph to answer the following questions.
(a) From the sale of 100 items, 400 items, and 700 items, rank from smallest to largest the amount of profit received. Explain your choices and note whether any of these scenarios results in a loss.
(b) From the sale of the 101st item, the 401st item, and the 701st item, rank from smallest to largest the amount of profit received. Explain your choices, and note whether any of these scenarios results in a loss.

Trending nowThis is a popular solution!

Chapter 9 Solutions
WebAssign Printed Access Card for Harshbarger/Reynolds' Mathematical Applications for the Management, Life, and Social Sciences, 12th Edition, Multi-Term


 Algebra for College StudentsAlgebraISBN:9781285195780Author:Jerome E. Kaufmann, Karen L. SchwittersPublisher:Cengage Learning
 Intermediate AlgebraAlgebraISBN:9781285195728Author:Jerome E. Kaufmann, Karen L. SchwittersPublisher:Cengage Learning
 Trigonometry (MindTap Course List)TrigonometryISBN:9781337278461Author:Ron LarsonPublisher:Cengage Learning