
Videos
Measuring Reaction Time Researchers at the University of Mississippi wanted to discover whether variability for reaction time to a go/no go stimulus of males was different from that of females. The researchers randomly selected 20 females and 15 males to participate in the study. The go/no go stimulus required the student to respond to a particular stimulus and not to respond to other stimuli. The data are in the next column.
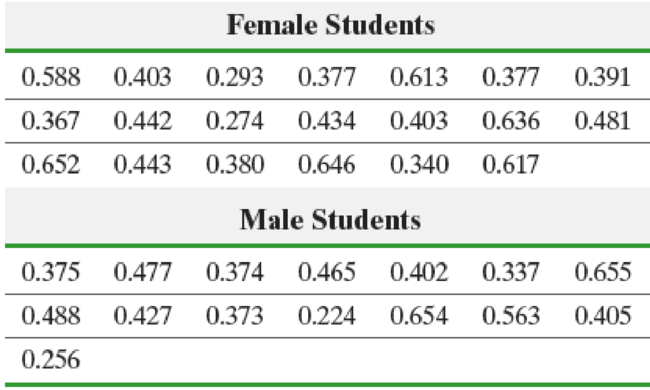
Source: PsychExperiments at the University of Mississippi (www.olemiss.edu/psychexps)
Normal probability plots indicate that the requirement of normality is satisfied. The output shown is from a TI-84 Plus C.
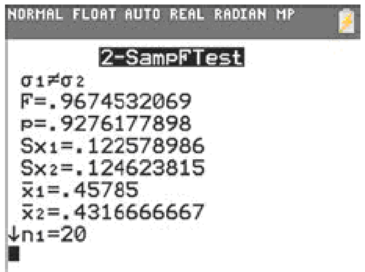
- (a) Use the results to determine whether there is a difference in variability of reaction time in males and females at the α = 0.05 level of significance.
- (b) Draw boxplots of each data set, using the same scale. Does this visual evidence support the results obtained in part (a)?
Want to see the full answer?
Check out a sample textbook solution
Chapter B.5 Solutions
Fundamentals of Statistics, Books a la Carte Edition Plus MyLab Statistics with Pearson eText -- Access Card Package (5th Edition)


 Glencoe Algebra 1, Student Edition, 9780079039897...AlgebraISBN:9780079039897Author:CarterPublisher:McGraw Hill
 Big Ideas Math A Bridge To Success Algebra 1: Stu...AlgebraISBN:9781680331141Author:HOUGHTON MIFFLIN HARCOURTPublisher:Houghton Mifflin Harcourt
 Algebra and Trigonometry (MindTap Course List)AlgebraISBN:9781305071742Author:James Stewart, Lothar Redlin, Saleem WatsonPublisher:Cengage Learning