
a.
Calculate the sampling interval and
a.
Explanation of Solution
Monetary unit sampling (MUS): Monetary unit sampling (MUS) provides an assessment regarding the amount of misstatement in the balance of “accounts or class of transactions”.
The sample size: The sample size signifies the number of items that the audit team inspects within a population of interest. Four major aspects that impact the sample size in an “attributes sampling application” are as follows:
- “Tolerable rate of deviation”.
- “Sampling risk-risk of overreliance, or risk of assessing control risk too low.
- “Expected population deviation rate”.
- “Population size”.
Sampling interval: The samples units from a larger population are picked corresponding to an arbitrary beginning point however with a fixed interval. This fixed interval is referred as sampling interval.
The required sample size for the audit of inventory is as follows:
| Particulars | Sample size | Workings |
| Risk of incorrect acceptance | 10% | |
| Ratio of expected to tolerable misstatement | 33.33% | |
| Tolerable misstatement as a percentage of population | 10% | |
Table (1)
Note: The tolerable misstatement as a percentage of population is 33.33 % which ranges from 30% (sample size 44) to 40% (sample size 58).
Calculate the sample size for the audit of Incorporation A’s inventory:
Step 1: Calculate the difference in sample size for an 8% tolerable misstatement and a 10% tolerable misstatement
Step 2: As the actual tolerable misstatement (33.33 percent) is one-third of the difference above
Note: Refer to EXHIBIT E.4.
Step 3: Adjust the sample size for the 30 percent tolerable misstatement by the result in step 2 to determine a sample size of 49items
Therefore, according to the above explanation, sample size is 49.
Note: Refer to exhibit GA.1.
Calculate the appropriate sampling interval:
Therefore, the appropriate sampling interval is $30,612.
Note: If higher sample size is taken (58 items), then the sampling interval will be $25,862(1).
Working note:
(1)Calculate the appropriate sampling interval:
b.
Re-perform the calculations in part (a) if Person W established a risk of incorrect acceptance of (1) 5 percent and (2) 20 percent and explain the relationship among the necessary level of the risk of incorrect acceptance, sample size and sampling interval.
b.
Explanation of Solution
(1)
In this case risk of incorrect acceptance is 5 percent.
The required sample size for the audit of inventory is as follows:
| Particulars | Sample size | Workings |
| Risk of incorrect acceptance | 5% | |
| Ratio of expected to tolerable misstatement | 33.33% | |
| Tolerable misstatement as a percentage of population | 10% | |
Table (2)
Note: The tolerable misstatement as a percentage of population is 33.33 % which ranges from 30% (sample size 60) to 40% (sample size 81).
Calculate the sample size for the audit of Incorporation A’s inventory:
Step 1: Calculate the difference in sample size for an 8% tolerable misstatement and a 10% tolerable misstatement
Step 2: As the actual tolerable misstatement (33.33 percent) is one-third of the difference above
Note: Refer to EXHIBIT E.4.
Step 3: Adjust the sample size for the 30 percent tolerable misstatement by the result in step 2 to determine a sample size of 67items
Therefore, according to the above explanation, sample size is 67.
Note: Refer to exhibit GA.1.
Calculate the appropriate sampling interval:
Therefore, the appropriate sampling interval is $22,388.
Note: If higher sample size is taken (81 items), then the sampling interval will be $18,518(2).
Working note:
(2)Calculate the appropriate sampling interval:
(2)
In this case risk of incorrect acceptance is 20 percent.
The required sample size for the audit of inventory is as follows:
| Particulars | Sample size | Workings |
| Risk of incorrect acceptance | 20% | |
| Ratio of expected to tolerable misstatement | 33.33% | |
| Tolerable misstatement as a percentage of population | 10% | |
Table (3)
Note: The tolerable misstatement as a percentage of population is 33.33 % which ranges from 30% (sample size 28) to 40% (sample size 36).
Calculate the sample size for the audit of Incorporation A’s inventory:
Step 1: Calculate the difference in sample size for an 8% tolerable misstatement and a 10% tolerable misstatement
Step 2: As the actual tolerable misstatement (33.33 percent) is one-third of the difference above
Note: Refer to EXHIBIT E.4.
Step 3: Adjust the sample size for the 30 percent tolerable misstatement by the result in step 2 to determine a sample size of 31items
Therefore, according to the above explanation, sample size is 31.
Note: Refer to exhibit GA.1.
Calculate the appropriate sampling interval:
Therefore, the appropriate sampling interval is $48,387.
Note: If higher sample size is taken (36 items), then the sampling interval will be $41,666(3).
Working note:
(3)Calculate the appropriate sampling interval:
By evaluating the responses to (a) and (b), it seems that the risk of incorrect acceptance (RIA) is having an “inverse relationship” with sample size (n) and a “direct relationship” with the sampling interval (SI), as shown below (assuming interpolation):
| Risk of incorrect acceptance | Item | Sampling interval |
| 5% | 67 | $22,388 |
| 10% | 49 | $30,612 |
| 20% | 31 | $48,387 |
(Table 4)
c.
Ascertain the projected misstatement.
c.
Explanation of Solution
Calculate the projected misstatement:
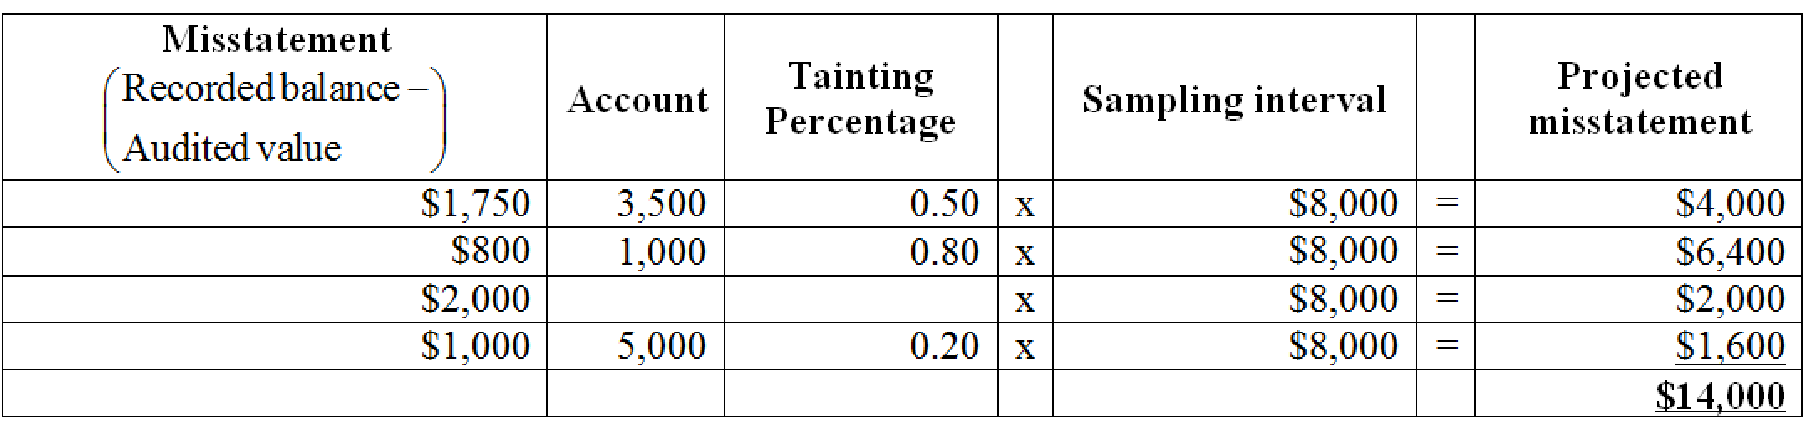
Figure (1)
Therefore, the amount of projected misstatement is $14,000.
Note: Part (c) is not related to parts (a) and (b), therefore projected misstatement is not calculated.
d.
Calculate the upper limit on misstatements.
d.
Explanation of Solution
Calculate the incremental allowance:
| Projected Misstatement |
Incremental factor minus 1 (Refer to table 7) | Incremental Allowance | ||
| $6,400 | x | = | $3,712 | |
| $4,000 | x | = | $1,760 | |
| $1,600 | x | = | $576 | |
| $6,048 |
Table (5)
Note: “For every projected misstatement, whose recorded balance is smaller than the sampling interval, rank the projected misstatements in descending order depending upon the dollar amount”.
Calculate the basic allowance for sampling risk:
Therefore, the basic allowance for sampling risk is $18,480.
Note: Confidence factor (2.31) is selected for 0 overstatement misstatements as these sampling intervals do not contain an overstatement error.
Calculate the upper limit on misstatements:
| Particulars | Amount |
| Projected misstatement | $14,000 |
| Incremental allowance for sampling risk | $6,048 |
| Basic allowance for sampling risk | $18,480 |
| Upper limit on misstatements | $38,528 |
Table (6)
Therefore, the upper limit on misstatements is $38,528.
Working note:
(4)Identify the Confidence Factors for Sample Evaluation:
| Number of overstatement misstatements | Risk of incorrect acceptance is 10% |
| 0 | 2.31 |
| 1 | 3.89 |
| 2 | 5.33 |
| 3 | 6.69 |
| 4 | 8.00 |
Table (7)
Note: Refer to exhibit GA.2.
e.
Re-perform the calculation in part (d) using a risk of incorrect acceptance of (1) 5 percent and (2) 20 percent and describe the relationship between the required level of risk of incorrect acceptance and the upper limit on misstatements.
e.
Explanation of Solution
(1)
In this case, risk of incorrect acceptance is 5%.
Calculate the incremental allowance:
| Projected Misstatement |
Incremental factor minus 1 (Refer to table 10) | Incremental Allowance | ||
| $6,400 | x | = | $4,800 | |
| $4,000 | x | = | $2,200 | |
| $1,600 | x | = | $736 | |
| $7,736 |
Table (8)
Note: “For every projected misstatement, whose recorded balance is smaller than the sampling interval, rank the projected misstatements in descending order depending upon the dollar amount”.
Calculate the basic allowance for sampling risk:
Therefore, the basic allowance for sampling risk is $24,000.
Note: Confidence factor (3.00) is selected for 0 overstatement misstatements as these sampling intervals do not contain an overstatement error.
Calculate the upper limit on misstatements:
| Particulars | Amount |
| Projected misstatement | $14,000 |
| Incremental allowance for sampling risk | $7,736 |
| Basic allowance for sampling risk | $24,000 |
| Upper limit on misstatements | $45,736 |
Table (9)
Therefore, the upper limit on misstatements is $45,736.
Working note:
(5)Identify the Confidence Factors for Sample Evaluation:
| Number of overstatement misstatements | Risk of incorrect acceptance is 5% |
| 0 | 3.00 |
| 1 | 4.75 |
| 2 | 6.30 |
| 3 | 7.76 |
| 4 | 9.16 |
Table (10)
Note: Refer to exhibit GA.2.
(2)
In this case, risk of incorrect acceptance is 20%.
Calculate the incremental allowance:
| Projected Misstatement |
Incremental factor minus 1 (Refer to table 13) | Incremental Allowance | ||
| $6,400 | x | = | $2,496 | |
| $4,000 | x | = | $1,120 | |
| $1,600 | x | = | $384 | |
| $4,000 |
Table (11)
Note: “For every projected misstatement, whose recorded balance is smaller than the sampling interval, rank the projected misstatements in descending order depending upon the dollar amount”.
Calculate the basic allowance for sampling risk:
Therefore, the basic allowance for sampling risk is $12,880.
Note: Confidence factor (1.61) is selected for 0 overstatement misstatements as these sampling intervals do not contain an overstatement error.
Calculate the upper limit on misstatements:
| Particulars | Amount |
| Projected misstatement | $14,000 |
| Incremental allowance for sampling risk | $4,000 |
| Basic allowance for sampling risk | $12,880 |
| Upper limit on misstatements | $30,880 |
Table (12)
Therefore, the upper limit on misstatements is $30,880.
Based on the above computations in (d) and (e), it seems that the risk of incorrect acceptance is having an inverse relationship with the upper limit on misstatements. For instance, the “upper limit on misstatements for a risk of incorrect acceptance of 5 percent is $45,736 and for a risk of incorrect acceptance of 20 percent, it is $30,880”.
Working note:
(1)Identify the Confidence Factors for Sample Evaluation:
| Number of overstatement misstatements | Risk of incorrect acceptance is 20% |
| 0 | 1.61 |
| 1 | 3.00 |
| 2 | 4.28 |
| 3 | 6.02 |
| 4 | 7.27 |
Table (13)
Note: Refer to exhibit GA.2.
f.
Explain the manner in which different levels of the risk of incorrect acceptance influence the likelihood of concluding that the account balance is fairly stated by using a risk of incorrect acceptance of (1) 5 percent, (2) 10 percent, and (3) 20 percent.
f.
Explanation of Solution
In all three examples, Person W could agree that the balance of
Want to see more full solutions like this?
Chapter G Solutions
Auditing & Assurance Services with ACL Software Student CD-ROM


 AccountingAccountingISBN:9781337272094Author:WARREN, Carl S., Reeve, James M., Duchac, Jonathan E.Publisher:Cengage Learning,
 Accounting Information SystemsAccountingISBN:9781337619202Author:Hall, James A.Publisher:Cengage Learning,
 Horngren's Cost Accounting: A Managerial Emphasis...AccountingISBN:9780134475585Author:Srikant M. Datar, Madhav V. RajanPublisher:PEARSON
 Intermediate AccountingAccountingISBN:9781259722660Author:J. David Spiceland, Mark W. Nelson, Wayne M ThomasPublisher:McGraw-Hill Education
 Financial and Managerial AccountingAccountingISBN:9781259726705Author:John J Wild, Ken W. Shaw, Barbara Chiappetta Fundamental Accounting PrinciplesPublisher:McGraw-Hill Education