In Exercises 49-52, use the bar graph, which shows the receipts of the federal government (in billions of dollars) for selected years from 2008 through 2014 . In each exercise, you are given the expenditures of the federal government. Find the magnitude of the surplus or deficit for the year. Year Receipts, R Expenditures , E ∣ R − E ∣ 2012 $ 3537.0 billo 2012 $ 3537.0 billion
In Exercises 49-52, use the bar graph, which shows the receipts of the federal government (in billions of dollars) for selected years from 2008 through 2014 . In each exercise, you are given the expenditures of the federal government. Find the magnitude of the surplus or deficit for the year. Year Receipts, R Expenditures , E ∣ R − E ∣ 2012 $ 3537.0 billo 2012 $ 3537.0 billion
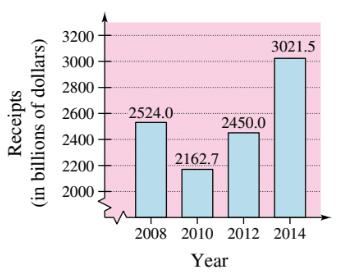
Solution Summary: The author calculates the value of left|R-Eright| for 2012 by using the given bar graph and E=3537.0
In Exercises 49-52, use the bar graph, which shows the receipts of the federal government (in billions of dollars) for selected years from
2008
through
2014
. In each exercise, you are given the expenditures of the federal government. Find the magnitude of the surplus or deficit for the year.
Year
Receipts,
R
Expenditures
,
E
∣
R
−
E
∣
2012
$
3537.0
billo
Need a deep-dive on the concept behind this application? Look no further. Learn more about this topic, algebra and related others by exploring similar questions and additional content below.


 Trigonometry (MindTap Course List)TrigonometryISBN:9781337278461Author:Ron LarsonPublisher:Cengage Learning
 Algebra: Structure And Method, Book 1AlgebraISBN:9780395977224Author:Richard G. Brown, Mary P. Dolciani, Robert H. Sorgenfrey, William L. ColePublisher:McDougal Littell
 Holt Mcdougal Larson Pre-algebra: Student Edition...AlgebraISBN:9780547587776Author:HOLT MCDOUGALPublisher:HOLT MCDOUGAL
 Big Ideas Math A Bridge To Success Algebra 1: Stu...AlgebraISBN:9781680331141Author:HOUGHTON MIFFLIN HARCOURTPublisher:Houghton Mifflin Harcourt
 Glencoe Algebra 1, Student Edition, 9780079039897...AlgebraISBN:9780079039897Author:CarterPublisher:McGraw Hill