Concept explainers
Videos
Life Science: incidence of breast cancer. The following graph approximates the incidence of breast cancer y, per 100,000 women, as a function of age x, where x represents ages 25 to 102.
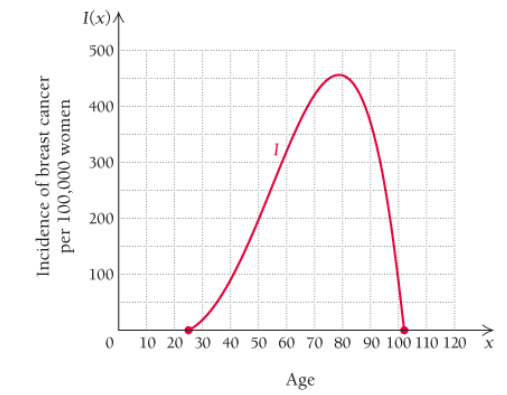
a. What is the incidence of breast cancer in 40-yr-old women?
b. For what ages is the incidence of breast cancer about 400 per 100,000 women?
c. Examine the graph and try to determine the age at which the largest incidence of breast cancer occurs.
d. What difficulty do you have making this determination?
Want to see the full answer?
Check out a sample textbook solution
Chapter R Solutions
Calculus And Its Applications, Books A La Carte Edition (11th Edition)
Additional Math Textbook Solutions
Precalculus: Concepts Through Functions, A Unit Circle Approach to Trigonometry (4th Edition)
Precalculus
Calculus & Its Applications (14th Edition)
Thomas' Calculus: Early Transcendentals (14th Edition)


 Trigonometry (MindTap Course List)TrigonometryISBN:9781337278461Author:Ron LarsonPublisher:Cengage Learning
 Glencoe Algebra 1, Student Edition, 9780079039897...AlgebraISBN:9780079039897Author:CarterPublisher:McGraw Hill
 College AlgebraAlgebraISBN:9781305115545Author:James Stewart, Lothar Redlin, Saleem WatsonPublisher:Cengage Learning
 Big Ideas Math A Bridge To Success Algebra 1: Stu...AlgebraISBN:9781680331141Author:HOUGHTON MIFFLIN HARCOURTPublisher:Houghton Mifflin Harcourt