
Concept explainers
Videos
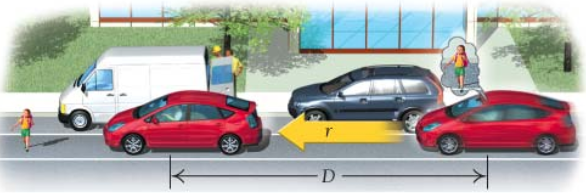
Reaction time. While driving a car, you see a child suddenly crossing the street. Your brain registers the emergency and sends a signal to your foot to hit the brake. The car travels a reaction distance D, in feet, during this time, where D is a function of the speed r, in miles per hour that the car is traveling when you see the child. That reaction distance is a linear function given by
a. Find
b. Graph
c. What is the domain of the function? Explain.
Want to see the full answer?
Check out a sample textbook solution
Chapter R Solutions
Calculus and Its Applications (11th Edition)
Additional Math Textbook Solutions
Glencoe Math Accelerated, Student Edition
Calculus & Its Applications (14th Edition)
Calculus: Early Transcendentals (2nd Edition)
Thomas' Calculus: Early Transcendentals (14th Edition)
Precalculus Enhanced with Graphing Utilities (7th Edition)


- Suppose the world’s oil reserves in 2014 are 1,820 billion barrels. If, on average, the total reserves are decreasing by 25 billion barrels of oil each year: a. Give a linear equation for the remaining oil reserves,R, in terms of t, the number of years since now. b. Seven years from now, what will the oil reserves be? c. If the rate at which the reserves are decreasing is constant, when will the world’s oil reserves be depleted?arrow_forwardSuppose that average annual income (in dollars) forthe years 1990 through 1999 is given by the linearfunction: I(x)=1,054x+23,286 , where x is thenumber of years after 1990. Which of the followinginterprets the slope in the context of the problem? a. As of 1990, average annual income was $23,286. b. In the ten-year period from 1990-1999, averageannual income increased by a total of $1,054. c. Each year in the decade of the 1990s, averageannual income increased by $1,054. d. Average annual income rose to a level of $23,286 bythe end of 1999.arrow_forwardTraffic Accidents The following table shows the cost C of traffic accidents. in cents per vehicle-mile, as a function of vehicular speed s, in miles per hour, for commercial vehicles driving at night on urban streets. Speed s 20 25 30 35 40 45 50 Cost C 1.3 0.4 0.1 0.3 0.9 2.2 5.8 The rate of vehicular involvement in traffic accidents per vehicle-mile can be modeled as a quadratic function of vehicular speed s, and the cost per vehicular involvement is roughly a linear function of s, so we expect that C the product of these two functions can be modeled as a cubic function of s. a. Use regression to find a cubic model for the data. Keep two decimal places for the regression parameters written in scientific notation. b. Calculate C(42) and explain what your answer means in practical terms. c. At what speed is the cost of traffic accidents for commercial vehicles driving at night on urban streets at a minimum? Consider speeds between 20 and 50 miles per hour.arrow_forward
- Health Care Expenditures The table shows annual personal health care expenditure in billions of dollars in the united states from 2011 through 2013 Source Bureau of Economic Analysis. Year 2011 2012 2013 Amount y 1765 1855 1920 (a) Create a system of linear equations for the data to fit the curve y=at2+bt+c where t=1 corresponds to 2011, and y is the amount of the expenditure. (b) Use the Cramers Rule to solve the system. (c) Use a graphing utility to plot the data and graph the polynomial function in the same viewing window. (d) Briefly describe how well the polynomial function fits the data.arrow_forwardProfit The demand equation for a microwave oven is given by p=1400.0001x, where p is the unit price (in dollars) of the microwave oven and x is the number of units sold. The cost equation for the microwave oven is C=80x+150,000, where C is the total cost (in dollars) and x is the number of units produced. The total profit P obtained by producing and selling x units is modeled by P=xpC. (a) Find the profit function P in terms of x. (b) Find the profit when 250,000 units are sold. (c) Find the unit price when 250,000 units are sold. (d) Find (if possible) the unit price that will yield a profit of 10 million dollars. If not possible, explain why.arrow_forwardManufacturing Cost The manager of a furniture factory finds that it costs 2200 to produce 100 chairs in one day and 4800 to produce 300 chairs in one day. a Assuming that the relationship between cost and the number of chairs produced is linear, find a linear function C that models the cost of producing x chairs in one day. b Draw a graph of C. What is the slope of this line? c At what rate does the factorys cost increase for every additional chair produced?arrow_forward
 Elementary Linear Algebra (MindTap Course List)AlgebraISBN:9781305658004Author:Ron LarsonPublisher:Cengage Learning
 Algebra and Trigonometry (MindTap Course List)AlgebraISBN:9781305071742Author:James Stewart, Lothar Redlin, Saleem WatsonPublisher:Cengage Learning
 Trigonometry (MindTap Course List)TrigonometryISBN:9781337278461Author:Ron LarsonPublisher:Cengage Learning
 College AlgebraAlgebraISBN:9781305115545Author:James Stewart, Lothar Redlin, Saleem WatsonPublisher:Cengage Learning
 Algebra & Trigonometry with Analytic GeometryAlgebraISBN:9781133382119Author:SwokowskiPublisher:Cengage