
Concept explainers
Videos
To construct: a box and whisker plot for the given data
Answer to Problem 13.4.2EP
The box and whiskers:

Explanation of Solution
Given:
Calculation:
Step 1:
Arrange the data in increasing order.
Draw the number line that contains the minimum and maximum values of the data.
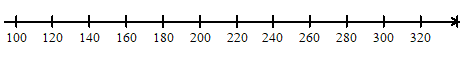
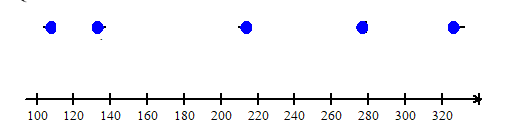
Step 2:
Mark the minimum and maximum values, median, upper and lower quartiles above the number line. Identify the outliers. Denote it with asterisk. It is not connected with the plot.
Here median is 215 .
Divide the data into two halves.
Median of lower half is
Median of upper half is
Step 3:
Draw the box and whiskers.
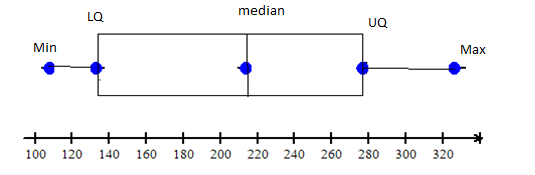
Conclusion:
Therefore, the box and whiskersplot is drawn.
Chapter SH Solutions
Pre-Algebra Student Edition
Additional Math Textbook Solutions
College Algebra (10th Edition)
Linear Algebra with Applications (2-Download)
Graphical Approach To College Algebra
Introductory and Intermediate Algebra for College Students (5th Edition)
Elementary and Intermediate Algebra


 Algebra and Trigonometry (6th Edition)AlgebraISBN:9780134463216Author:Robert F. BlitzerPublisher:PEARSON
 Contemporary Abstract AlgebraAlgebraISBN:9781305657960Author:Joseph GallianPublisher:Cengage Learning
 Linear Algebra: A Modern IntroductionAlgebraISBN:9781285463247Author:David PoolePublisher:Cengage Learning
 Algebra And Trigonometry (11th Edition)AlgebraISBN:9780135163078Author:Michael SullivanPublisher:PEARSON
 Introduction to Linear Algebra, Fifth EditionAlgebraISBN:9780980232776Author:Gilbert StrangPublisher:Wellesley-Cambridge Press
 College Algebra (Collegiate Math)AlgebraISBN:9780077836344Author:Julie Miller, Donna GerkenPublisher:McGraw-Hill Education