From the descriptions provided, identify the type of study design: bq.A detailed description of a new illness that has not yet been fully understood. The description includes the basic etiology of the disease, including symptoms, laboratory results (i.e., inflammatory biomarkers, functional biomarkers, kidney and liver function, etc.), and histology from several tissue samples that were all obtained from one patient. 6b-A study of fatal car crash rates across each state that are known to have different driving laws. 6c-Questionnaires were mailed to every 20th person listed in the city phone directory. Each person was asked to provide information on their smoking and alcohol consumption habits.
From the descriptions provided, identify the type of study design: bq.A detailed description of a new illness that has not yet been fully understood. The description includes the basic etiology of the disease, including symptoms, laboratory results (i.e., inflammatory biomarkers, functional biomarkers, kidney and liver function, etc.), and histology from several tissue samples that were all obtained from one patient. 6b-A study of fatal car crash rates across each state that are known to have different driving laws. 6c-Questionnaires were mailed to every 20th person listed in the city phone directory. Each person was asked to provide information on their smoking and alcohol consumption habits.

Glencoe Algebra 1, Student Edition, 9780079039897, 0079039898, 2018
18th Edition
ISBN:9780079039897
Author:Carter
Publisher:Carter
Chapter10: Statistics
Section10.1: Measures Of Center
Problem 9PPS

Related questions
Question
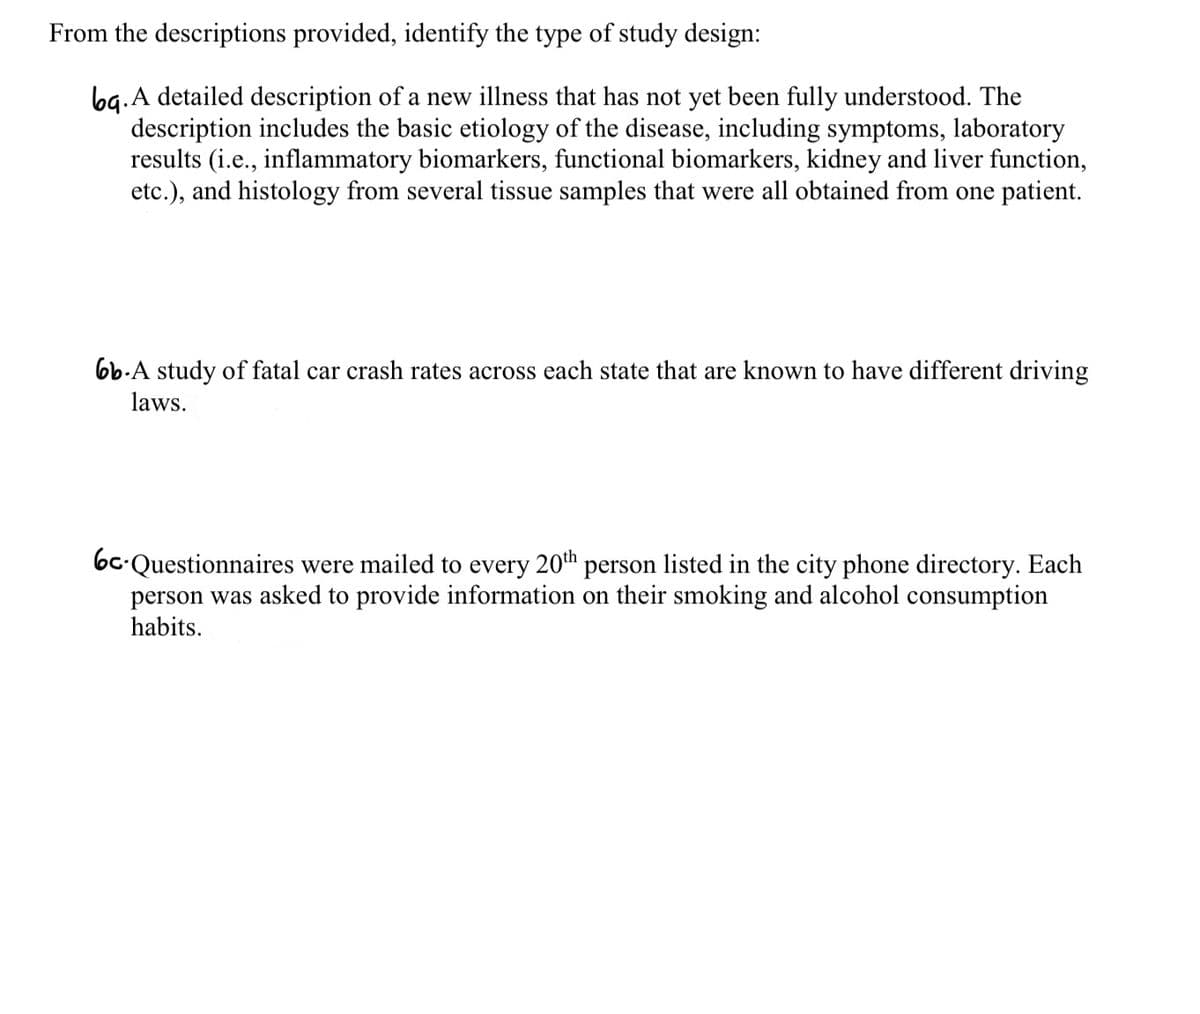
Transcribed Image Text:From the descriptions provided, identify the type of study design:
bq. A detailed description of a new illness that has not yet been fully understood. The
description includes the basic etiology of the disease, including symptoms, laboratory
results (i.e., inflammatory biomarkers, functional biomarkers, kidney and liver function,
etc.), and histology from several tissue samples that were all obtained from one patient.
6b-A study of fatal car crash rates across each state that are known to have different driving
laws.
6c-Questionnaires were mailed to every 20th person listed in the city phone directory. Each
person was asked to provide information on their smoking and alcohol consumption
habits.
Expert Solution
This question has been solved!
Explore an expertly crafted, step-by-step solution for a thorough understanding of key concepts.

Step by step
Solved in 2 steps

Recommended textbooks for you
Glencoe Algebra 1, Student Edition, 9780079039897…
Algebra
ISBN:
9780079039897
Author:
Carter
Publisher:
McGraw Hill
Glencoe Algebra 1, Student Edition, 9780079039897…
Algebra
ISBN:
9780079039897
Author:
Carter
Publisher:
McGraw Hill