1. Consider the function R(m). Why is it appropriate to use a linear regression to model this function relationship O (a) All functions can be modeled with linear regression. O (b) The average rate of change is nearly constant across the given input intervals. O (c) The average rate of change is exactly constant across the given input intervals. O(d) The percent change is nearly constant across the given input intervals.
1. Consider the function R(m). Why is it appropriate to use a linear regression to model this function relationship O (a) All functions can be modeled with linear regression. O (b) The average rate of change is nearly constant across the given input intervals. O (c) The average rate of change is exactly constant across the given input intervals. O(d) The percent change is nearly constant across the given input intervals.

MATLAB: An Introduction with Applications
6th Edition
ISBN:9781119256830
Author:Amos Gilat
Publisher:Amos Gilat
Chapter1: Starting With Matlab
Section: Chapter Questions
Problem 1P

Related questions

Concept explainers
Equations and Inequations
Equations and inequalities describe the relationship between two mathematical expressions.
Linear Functions
A linear function can just be a constant, or it can be the constant multiplied with the variable like x or y. If the variables are of the form, x2, x1/2 or y2 it is not linear. The exponent over the variables should always be 1.
Question
Hello, can I please get some help with this equation? Thank you
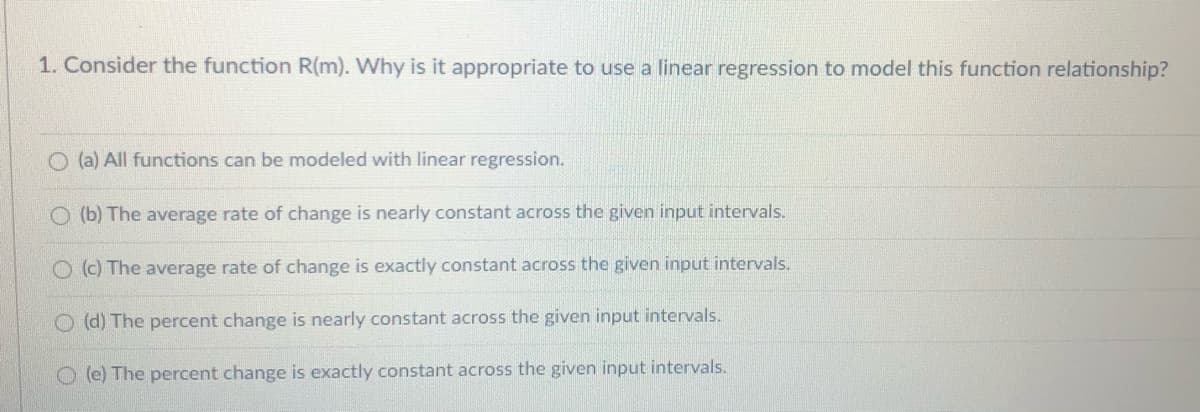
Transcribed Image Text:1. Consider the function R(m). Why is it appropriate to use a linear regression to model this function relationship?
(a) All functions can be modeled with linear regression.
O (b) The average rate of change is nearly constant across the given input intervals.
O (c) The average rate of change is exactly constant across the given input intervals.
O (d) The percent change is nearly constant across the given input intervals.
O (e) The percent change is exactly constant across the given input intervals.
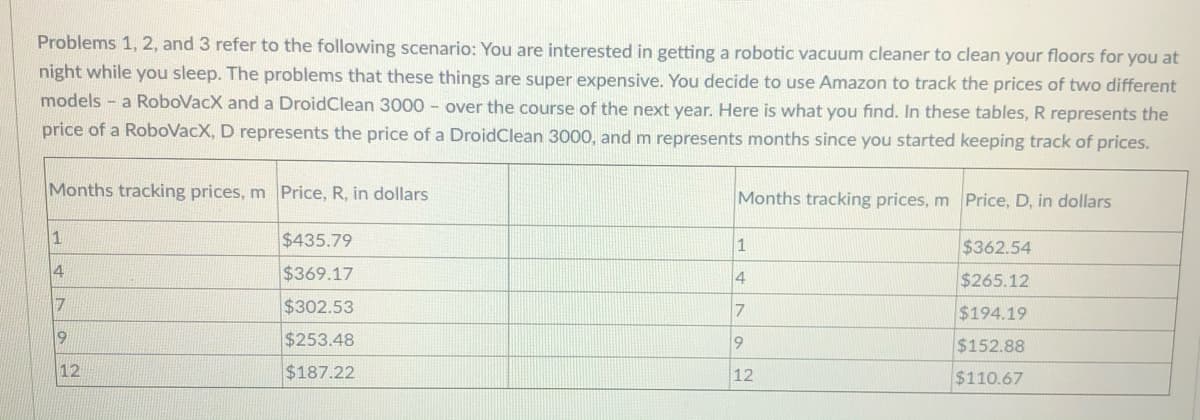
Transcribed Image Text:Problems 1, 2, and 3 refer to the following scenario: You are interested in getting a robotic vacuum cleaner to clean your floors for you at
night while you sleep. The problems that these things are super expensive. You decide to use Amazon to track the prices of two different
models - a RoboVacX and a DroidClean 3000 - over the course of the next year. Here is what you find. In these tables,R represents the
price of a RoboVacX, D represents the price of a DroidClean 3000, and m represents months since you started keeping track of prices.
Months tracking prices, m Price, R, in dollars
Months tracking prices, m Price, D, in dollars
1
$435.79
$362.54
1
14
$369.17
4
$265.12
17
$302.53
17
$194.19
19
$253.48
9
$152.88
12
$187.22
12
$110.67
Expert Solution
This question has been solved!
Explore an expertly crafted, step-by-step solution for a thorough understanding of key concepts.

This is a popular solution!

Trending now
This is a popular solution!

Step by step
Solved in 2 steps

Knowledge Booster


Learn more about
Need a deep-dive on the concept behind this application? Look no further. Learn more about this topic, statistics and related others by exploring similar questions and additional content below.Recommended textbooks for you
MATLAB: An Introduction with Applications
Statistics
ISBN:
9781119256830
Author:
Amos Gilat
Publisher:
John Wiley & Sons Inc

Probability and Statistics for Engineering and th…
Statistics
ISBN:
9781305251809
Author:
Jay L. Devore
Publisher:
Cengage Learning

Statistics for The Behavioral Sciences (MindTap C…
Statistics
ISBN:
9781305504912
Author:
Frederick J Gravetter, Larry B. Wallnau
Publisher:
Cengage Learning
MATLAB: An Introduction with Applications
Statistics
ISBN:
9781119256830
Author:
Amos Gilat
Publisher:
John Wiley & Sons Inc
Probability and Statistics for Engineering and th…
Statistics
ISBN:
9781305251809
Author:
Jay L. Devore
Publisher:
Cengage Learning
Statistics for The Behavioral Sciences (MindTap C…
Statistics
ISBN:
9781305504912
Author:
Frederick J Gravetter, Larry B. Wallnau
Publisher:
Cengage Learning

Elementary Statistics: Picturing the World (7th E…
Statistics
ISBN:
9780134683416
Author:
Ron Larson, Betsy Farber
Publisher:
PEARSON

The Basic Practice of Statistics
Statistics
ISBN:
9781319042578
Author:
David S. Moore, William I. Notz, Michael A. Fligner
Publisher:
W. H. Freeman

Introduction to the Practice of Statistics
Statistics
ISBN:
9781319013387
Author:
David S. Moore, George P. McCabe, Bruce A. Craig
Publisher:
W. H. Freeman