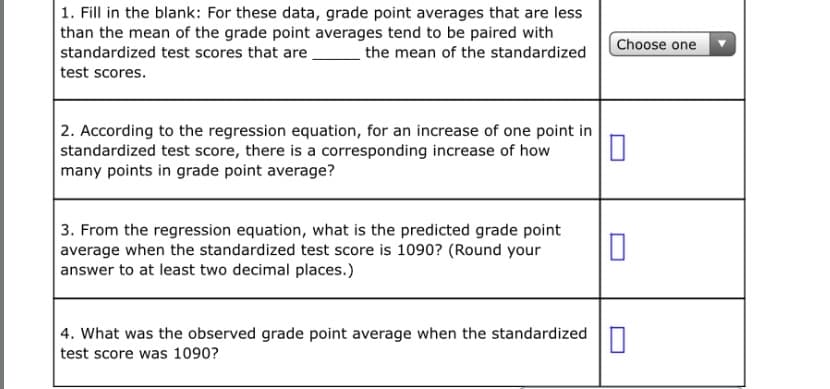
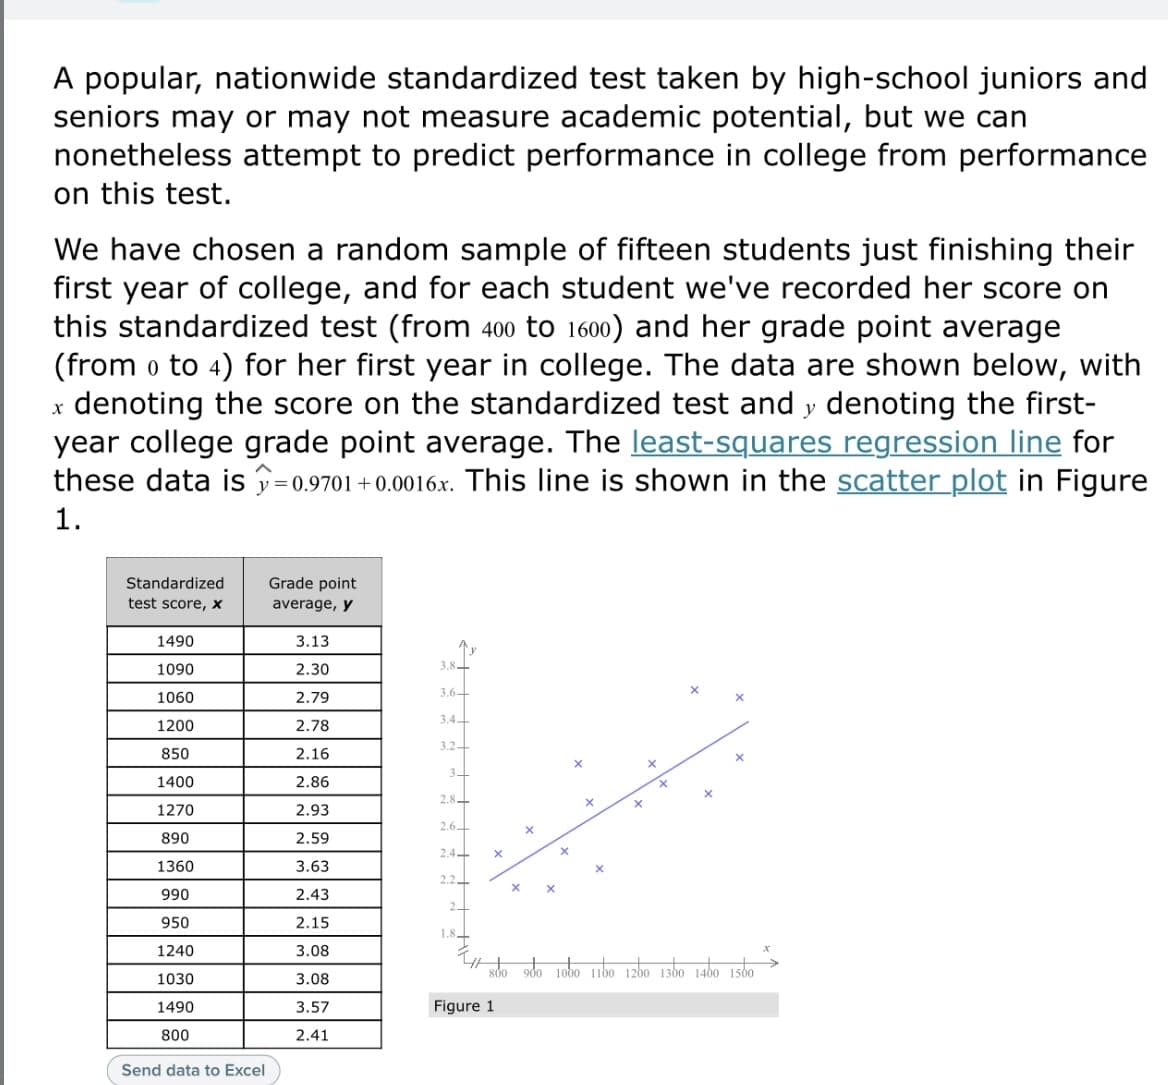
1. Fill in the blank: For these data, grade point averages that are less than the mean of the grade point averages tend to be paired with standardized test scores that are Choose one the mean of the standardized test scores. |2. According to the regression equation, for an increase of one point in standardized test score, there is a corresponding increase of how many points in grade point average? 3. From the regression equation, what is the predicted grade point average when the standardized test score is 1090? (Round your answer to at least two decimal places.) 4. What was the observed grade point average when the standardized O test score was 1090?


Correlation
Correlation defines a relationship between two independent variables. It tells the degree to which variables move in relation to each other. When two sets of data are related to each other, there is a correlation between them.
Linear Correlation
A correlation is used to determine the relationships between numerical and categorical variables. In other words, it is an indicator of how things are connected to one another. The correlation analysis is the study of how variables are related.
Regression Analysis
Regression analysis is a statistical method in which it estimates the relationship between a dependent variable and one or more independent variable. In simple terms dependent variable is called as outcome variable and independent variable is called as predictors. Regression analysis is one of the methods to find the trends in data. The independent variable used in Regression analysis is named Predictor variable. It offers data of an associated dependent variable regarding a particular outcome.


Trending now
This is a popular solution!

Step by step
Solved in 2 steps


