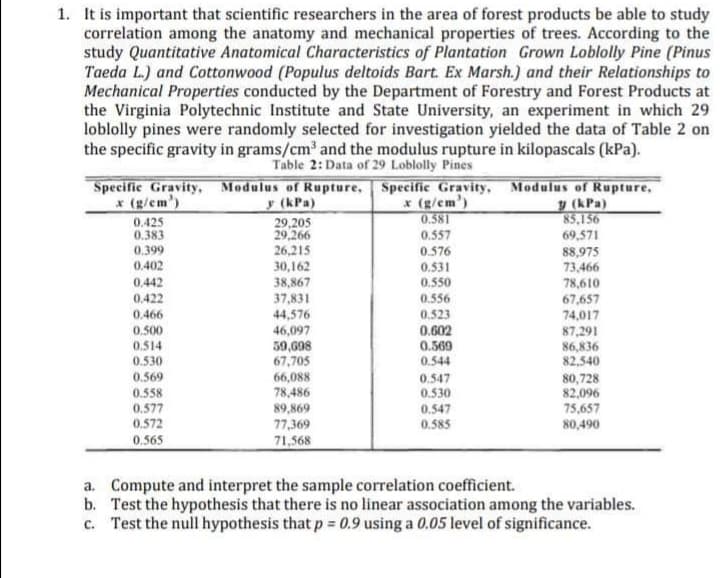
1. It is important that scientific researchers in the area of forest products be able to study correlation among the anatomy and mechanical properties of trees. According to the study Quantitative Anatomical Characteristics of Plantation Grown Loblolly Pine (Pinus Taeda L.) and Cottonwood (Populus deltoids Bart. Ex Marsh.) and their Relationships to Mechanical Properties conducted by the Department of Forestry and Forest Products at the Virginia Polytechnic Institute and State University, an experiment in which 29 loblolly pines were randomly selected for investigation yielded the data of Table 2 on the specific gravity in grams/cm' and the modulus rupture in kilopascals (kPa). Table 2: Data of 29 Loblolly Pines Specific Gravity, Modulus of Rupture, Specific Gravity, Modulus of Rupture, * (g/cm') x (g/em') 0.581 0.557 y (kPa) 85,156 y (kPa) 0.425 0.383 0.399 29,205 29.266 26,215 30,162 38,867 69,571 0.576 88,975 73,466 78,610 67,657 74,017 87,291 86,836 82,540 0.402 0.531 0.550 0.442 37,831 44,576 0.556 0.422 0.466 0.523 0.602 0.569 0.500 46,097 59,698 67,705 66,088 78,486 89,869 77,369 0.514 0.530 0.544 0.569 80,728 82,096 75,657 80,490 0.547 0.530 0.558 0.577 0.572 0.547 0.585 0.565 71,568 a. Compute and interpret the sample correlation coefficient. b. Test the hypothesis that there is no linear association among the variables. c. Test the null hypothesis that p = 0.9 using a 0.05 level of significance.
1. It is important that scientific researchers in the area of forest products be able to study correlation among the anatomy and mechanical properties of trees. According to the study Quantitative Anatomical Characteristics of Plantation Grown Loblolly Pine (Pinus Taeda L.) and Cottonwood (Populus deltoids Bart. Ex Marsh.) and their Relationships to Mechanical Properties conducted by the Department of Forestry and Forest Products at the Virginia Polytechnic Institute and State University, an experiment in which 29 loblolly pines were randomly selected for investigation yielded the data of Table 2 on the specific gravity in grams/cm' and the modulus rupture in kilopascals (kPa). Table 2: Data of 29 Loblolly Pines Specific Gravity, Modulus of Rupture, Specific Gravity, Modulus of Rupture, * (g/cm') x (g/em') 0.581 0.557 y (kPa) 85,156 y (kPa) 0.425 0.383 0.399 29,205 29.266 26,215 30,162 38,867 69,571 0.576 88,975 73,466 78,610 67,657 74,017 87,291 86,836 82,540 0.402 0.531 0.550 0.442 37,831 44,576 0.556 0.422 0.466 0.523 0.602 0.569 0.500 46,097 59,698 67,705 66,088 78,486 89,869 77,369 0.514 0.530 0.544 0.569 80,728 82,096 75,657 80,490 0.547 0.530 0.558 0.577 0.572 0.547 0.585 0.565 71,568 a. Compute and interpret the sample correlation coefficient. b. Test the hypothesis that there is no linear association among the variables. c. Test the null hypothesis that p = 0.9 using a 0.05 level of significance.

MATLAB: An Introduction with Applications
6th Edition
ISBN:9781119256830
Author:Amos Gilat
Publisher:Amos Gilat
Chapter1: Starting With Matlab
Section: Chapter Questions
Problem 1P

Related questions
Question
kindly write legibly and capture the image clear.
Transcribed Image Text:1. It is important that scientific researchers in the area of forest products be able to study
correlation among the anatomy and mechanical properties of trees. According to the
study Quantitative Anatomical Characteristics of Plantation Grown Loblolly Pine (Pinus
Taeda L.) and Cottonwood (Populus deltoids Bart. Ex Marsh.) and their Relationships to
Mechanical Properties conducted by the Department of Forestry and Forest Products at
the Virginia Polytechnic Institute and State University, an experiment in which 29
loblolly pines were randomly selected for investigation yielded the data of Table 2 on
the specific gravity in grams/cm and the modulus rupture in kilopascals (kPa).
Table 2: Data of 29 Loblolly Pines
Specific Gravity, Modulus of Rupture, Specific Gravity, Modulus of Rupture,
x (g/em')
0.425
0.383
0.399
y (kPa)
x (g/em')
0.581
y (kPa)
85,156
29,205
29,266
26,215
30,162
38,867
37,831
44,576
0.557
69,571
0.576
0.531
0.550
88,975
73,466
0.402
0.442
0.422
78,610
67,657
74,017
87,291
0.556
0.466
0.523
0.500
0.514
0.602
46,097
59,698
67,705
66,088
78,486
89,869
77,369
0.569
86,836
82,540
0.530
0.569
0.558
0.577
0.572
0.544
80,728
82,096
75,657
80,490
0.547
0.530
0.547
0.585
0.565
71,568
a. Compute and interpret the sample correlation coefficient.
b. Test the hypothesis that there is no linear association among the variables.
c. Test the null hypothesis that p = 0.9 using a 0.05 level of significance.
Expert Solution
This question has been solved!
Explore an expertly crafted, step-by-step solution for a thorough understanding of key concepts.

This is a popular solution!

Trending now
This is a popular solution!

Step by step
Solved in 5 steps

Knowledge Booster


Learn more about
Need a deep-dive on the concept behind this application? Look no further. Learn more about this topic, statistics and related others by exploring similar questions and additional content below.Recommended textbooks for you
MATLAB: An Introduction with Applications
Statistics
ISBN:
9781119256830
Author:
Amos Gilat
Publisher:
John Wiley & Sons Inc

Probability and Statistics for Engineering and th…
Statistics
ISBN:
9781305251809
Author:
Jay L. Devore
Publisher:
Cengage Learning

Statistics for The Behavioral Sciences (MindTap C…
Statistics
ISBN:
9781305504912
Author:
Frederick J Gravetter, Larry B. Wallnau
Publisher:
Cengage Learning
MATLAB: An Introduction with Applications
Statistics
ISBN:
9781119256830
Author:
Amos Gilat
Publisher:
John Wiley & Sons Inc
Probability and Statistics for Engineering and th…
Statistics
ISBN:
9781305251809
Author:
Jay L. Devore
Publisher:
Cengage Learning
Statistics for The Behavioral Sciences (MindTap C…
Statistics
ISBN:
9781305504912
Author:
Frederick J Gravetter, Larry B. Wallnau
Publisher:
Cengage Learning

Elementary Statistics: Picturing the World (7th E…
Statistics
ISBN:
9780134683416
Author:
Ron Larson, Betsy Farber
Publisher:
PEARSON

The Basic Practice of Statistics
Statistics
ISBN:
9781319042578
Author:
David S. Moore, William I. Notz, Michael A. Fligner
Publisher:
W. H. Freeman

Introduction to the Practice of Statistics
Statistics
ISBN:
9781319013387
Author:
David S. Moore, George P. McCabe, Bruce A. Craig
Publisher:
W. H. Freeman