1. The department manager using a combination of methods has forecast sales of toasters at a local department store. Calculate the MAD for the manager's forecast. Compare the manager's forecast against a naive forecast. Which is better? Manager's Forecast Month Unit Sales January February 52 61 March 73 April Мay 79 66 June 51 47 50 July August September 44 55 30 52 Octobor 55 12
1. The department manager using a combination of methods has forecast sales of toasters at a local department store. Calculate the MAD for the manager's forecast. Compare the manager's forecast against a naive forecast. Which is better? Manager's Forecast Month Unit Sales January February 52 61 March 73 April Мay 79 66 June 51 47 50 July August September 44 55 30 52 Octobor 55 12

Purchasing and Supply Chain Management
6th Edition
ISBN:9781285869681
Author:Robert M. Monczka, Robert B. Handfield, Larry C. Giunipero, James L. Patterson
Publisher:Robert M. Monczka, Robert B. Handfield, Larry C. Giunipero, James L. Patterson
ChapterC: Cases
Section: Chapter Questions
Problem 5.3SD: Scenario 4 Sharon Gillespie, a new buyer at Visionex, Inc., was reviewing quotations for a tooling...

Related questions
Question
Transcribed Image Text:1:46
口
Forecasting Assignment
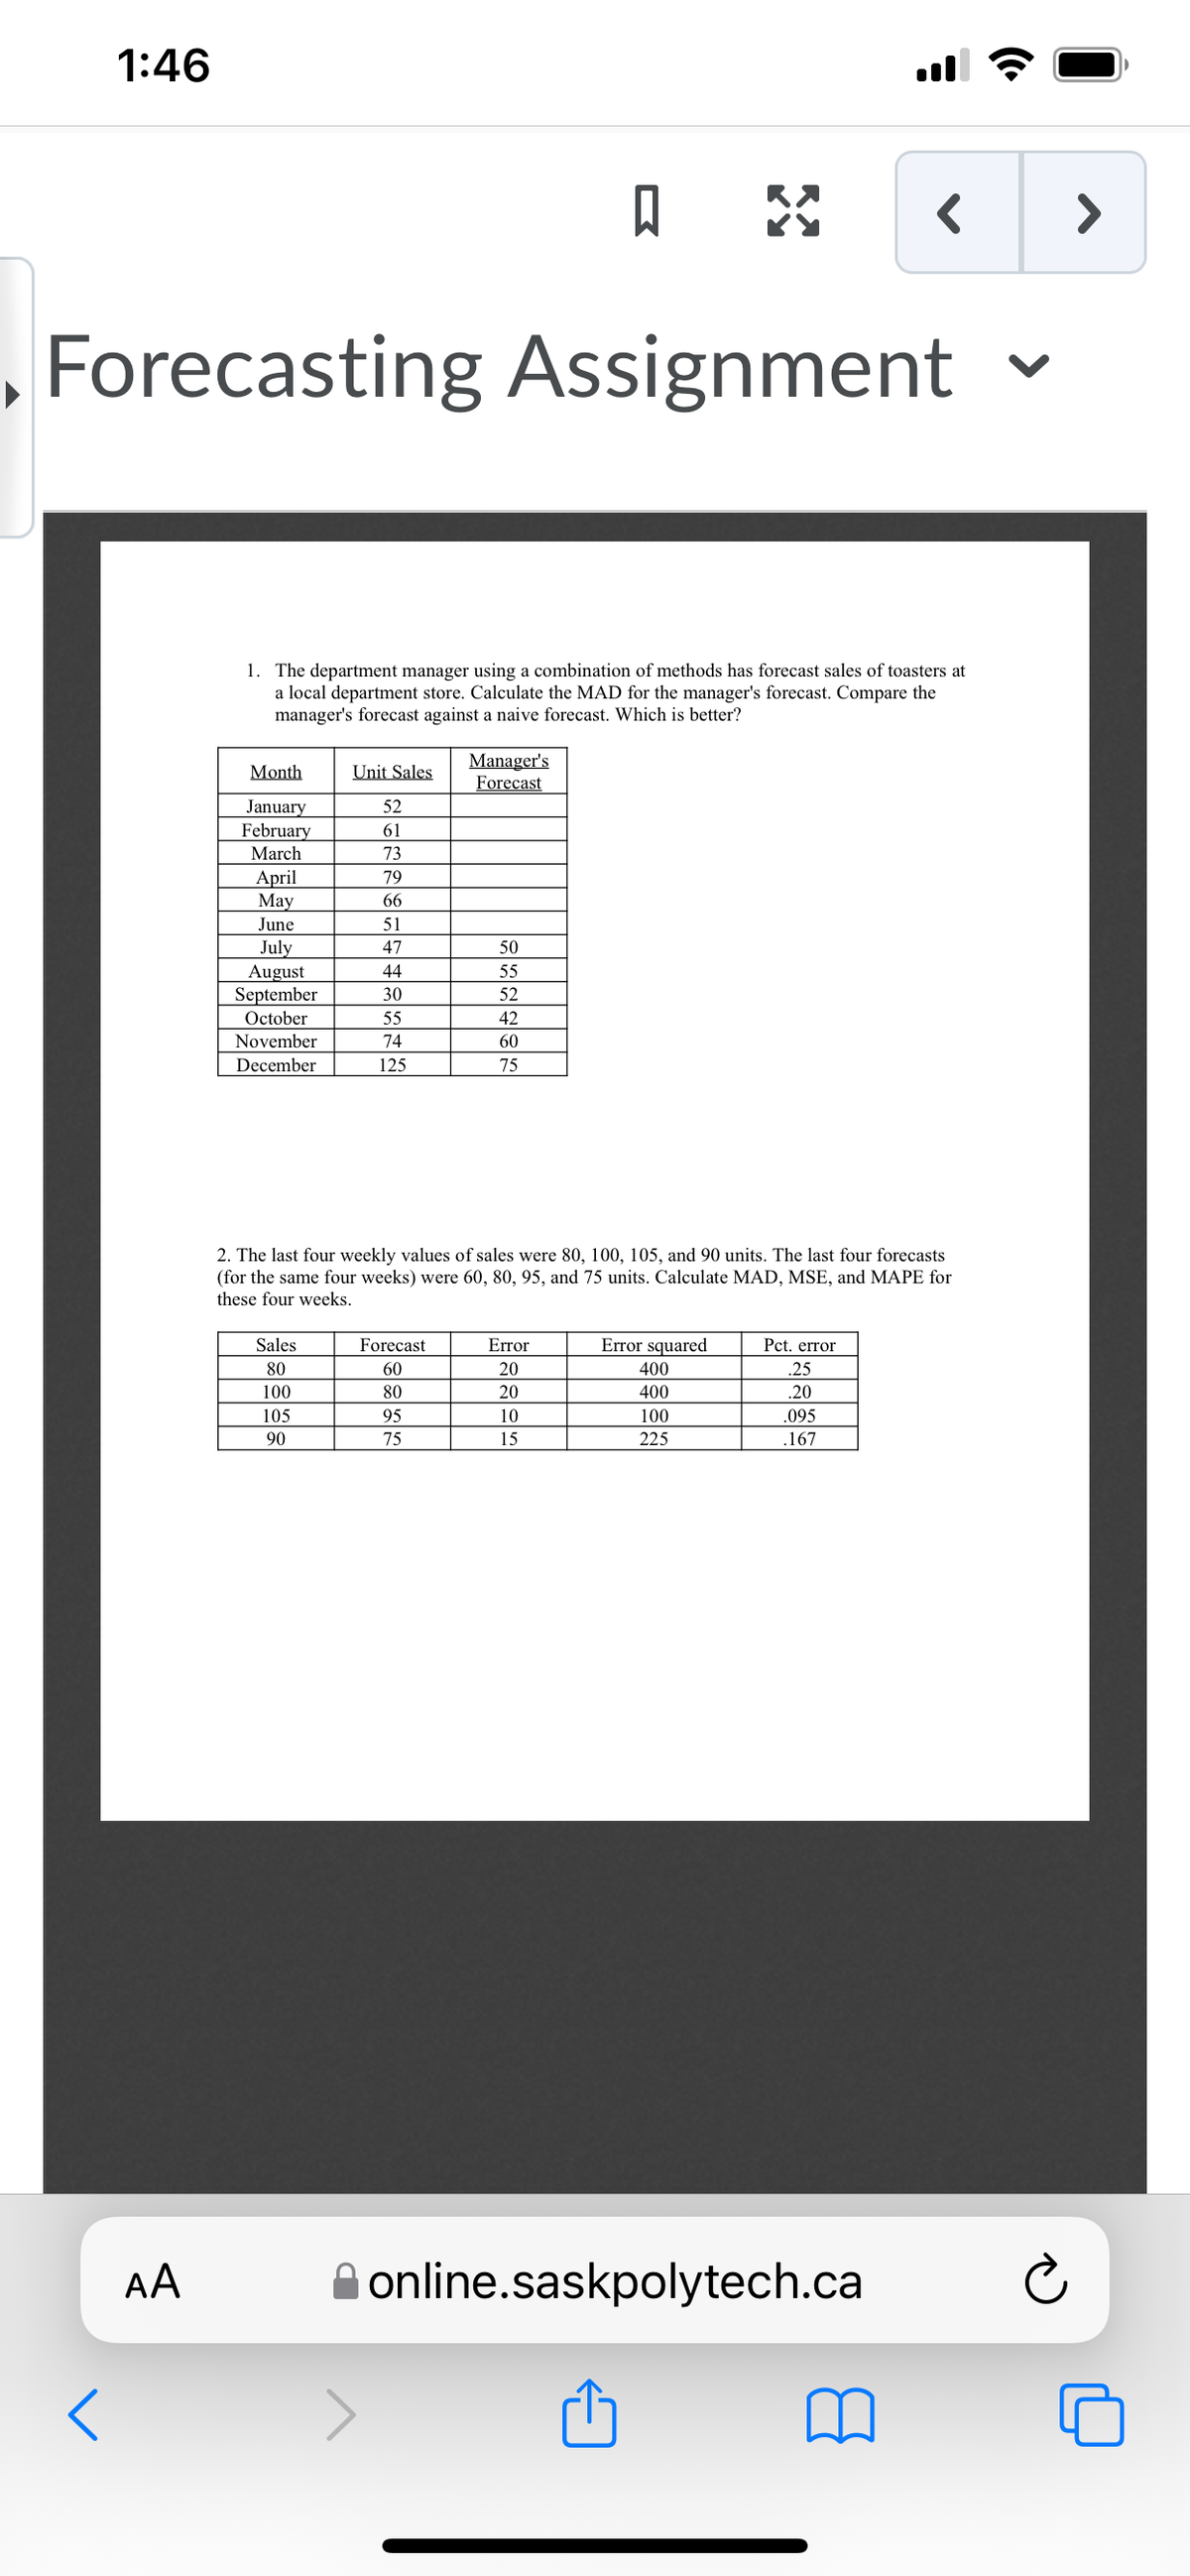
1. The department manager using a combination of methods has forecast sales of toasters at
a local department store. Calculate the MAD for the manager's forecast. Compare the
manager's forecast against a naive forecast. Which is better?
Manager's
Forecast
Month
Unit Sales
January
February
52
61
March
73
April
Мay
79
66
June
51
July
August
September
47
50
44
55
30
52
October
55
42
November
74
60
December
125
75
2. The last four weekly values of sales were 80, 100, 105, and 90 units. The last four forecasts
(for the same four weeks) were 60, 80, 95, and 75 units. Calculate MAD, MSE, and MAPE for
these four weeks.
Sales
Forecast
Error
Error squared
Pct. error
80
60
20
400
.25
100
80
20
400
.20
105
95
10
100
.095
90
75
15
225
.167
AA
A online.saskpolytech.ca
Expert Solution
This question has been solved!
Explore an expertly crafted, step-by-step solution for a thorough understanding of key concepts.

This is a popular solution!

Trending now
This is a popular solution!

Step by step
Solved in 3 steps with 2 images

Recommended textbooks for you
Purchasing and Supply Chain Management
Operations Management
ISBN:
9781285869681
Author:
Robert M. Monczka, Robert B. Handfield, Larry C. Giunipero, James L. Patterson
Publisher:
Cengage Learning

Contemporary Marketing
Marketing
ISBN:
9780357033777
Author:
Louis E. Boone, David L. Kurtz
Publisher:
Cengage Learning

Marketing
Marketing
ISBN:
9780357033791
Author:
Pride, William M
Publisher:
South Western Educational Publishing
Purchasing and Supply Chain Management
Operations Management
ISBN:
9781285869681
Author:
Robert M. Monczka, Robert B. Handfield, Larry C. Giunipero, James L. Patterson
Publisher:
Cengage Learning
Contemporary Marketing
Marketing
ISBN:
9780357033777
Author:
Louis E. Boone, David L. Kurtz
Publisher:
Cengage Learning
Marketing
Marketing
ISBN:
9780357033791
Author:
Pride, William M
Publisher:
South Western Educational Publishing