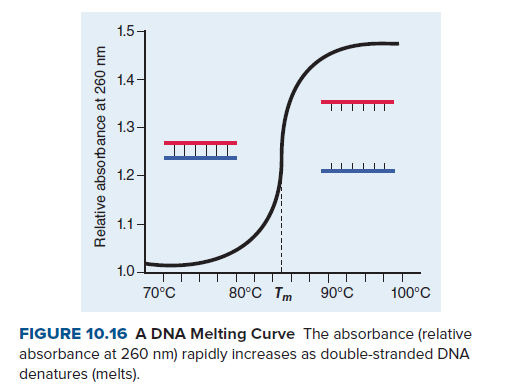
1.5 1.4- 1.3- 1.2- 1.1- 1.0- 70°C 80°C Tm 90°C 100°C FIGURE 10.16 A DNA Melting Curve The absorbance (relative absorbance at 260 nm) rapidly increases as double-stranded DNA denatures (melts). Relative absorbance at 260 nm
1.5 1.4- 1.3- 1.2- 1.1- 1.0- 70°C 80°C Tm 90°C 100°C FIGURE 10.16 A DNA Melting Curve The absorbance (relative absorbance at 260 nm) rapidly increases as double-stranded DNA denatures (melts). Relative absorbance at 260 nm

Human Heredity: Principles and Issues (MindTap Course List)
11th Edition
ISBN:9781305251052
Author:Michael Cummings
Publisher:Michael Cummings
Chapter8: The Structure, Replication, And Chromosomal Organization Of Dna
Section: Chapter Questions
Problem 12QP: DNA contains many hydrogen bonds. Are hydrogen bonds stronger or weaker than covalent bonds? What...

Related questions

Question
In figure 10.16 , how would the curve appear if the GC content of the DNA sample were increased? How would the curve appear if the AT content were increased?
Transcribed Image Text:1.5
1.4-
1.3-
1.2-
1.1-
1.0-
70°C
80°C Tm
90°C
100°C
FIGURE 10.16 A DNA Melting Curve The absorbance (relative
absorbance at 260 nm) rapidly increases as double-stranded DNA
denatures (melts).
Relative absorbance at 260 nm
Expert Solution
This question has been solved!
Explore an expertly crafted, step-by-step solution for a thorough understanding of key concepts.

This is a popular solution!

Trending now
This is a popular solution!

Step by step
Solved in 2 steps

Knowledge Booster


Learn more about
Need a deep-dive on the concept behind this application? Look no further. Learn more about this topic, biology and related others by exploring similar questions and additional content below.Recommended textbooks for you
Human Heredity: Principles and Issues (MindTap Co…
Biology
ISBN:
9781305251052
Author:
Michael Cummings
Publisher:
Cengage Learning
Human Heredity: Principles and Issues (MindTap Co…
Biology
ISBN:
9781305251052
Author:
Michael Cummings
Publisher:
Cengage Learning