
MATLAB: An Introduction with Applications
6th Edition
ISBN: 9781119256830
Author: Amos Gilat
Publisher: John Wiley & Sons Inc
expand_more
expand_more
format_list_bulleted
Related questions
Question
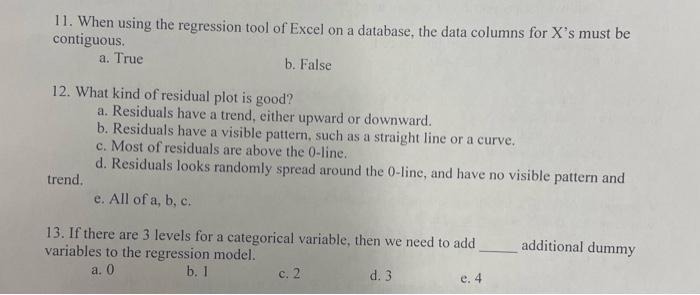

Transcribed Image Text:11. When using the regression tool of Excel on a database, the data columns for X's must be
contiguous.
a. True
b. False
12. What kind of residual plot is good?
trend.
a. Residuals have a trend, either upward or downward.
b. Residuals have a visible pattern, such as a straight line or a curve.
c. Most of residuals are above the 0-line.
d. Residuals looks randomly spread around the 0-line, and have no visible pattern and
e. All of a, b, c.
13. If there are 3 levels for a categorical variable, then we need to add
variables to the regression model.
a. 0
b. 1
c. 2
d. 3
e. 4
additional dummy
Expert Solution
This question has been solved!
Explore an expertly crafted, step-by-step solution for a thorough understanding of key concepts.

Step by stepSolved in 2 steps

Knowledge Booster

Similar questions
- Last years Data Management class decided to see if there was a relationship between the score (out of 10) a student got on the two-variable stats quiz, and their score (out of 30) on the unit test. Use the given data to Quiz Score Test Score 6 8 10 9 10 20 26 29 26 30 a) Calculate the correlation coefficient. b) Perform a linear regression.arrow_forwardSuppose the estimaited OLS regression is: Happiness = a + b*dailychocolates Now use chocolate consumprion per week instead of days. What is the relationship between the old and new units? How would this affect b (i.e. what is bnew in terms of b)?arrow_forwardSolve attached photo.arrow_forward
- State whether the slope of a simple linear regression line is statistically significant, then the correlation will also always be significant?arrow_forwardresearcher would like to examine the effect of fertilizer on flower growth. She obtains several flowers. She randomly assigns half the plants to the no fertilizer condition. The other half of the plants receive fertilizer. She monitors their growth for a month. She then compares the amount of growth of the two sets of plants. Is there a difference in growth between the no fertilizer and the fertilizer conditions? Use the .05 level of significance. In addition, find Cohen’s d and state what the effect size is in a sentence. Growth Rating No Fertilizer 40,21,27,30, 47 Fertilizer 46,25, 24, 38, 53arrow_forwardInterpret the slope of the least square regression line in contentarrow_forward
- Two variables have a positive linear correlation. Is the slope of the regression line for the variables positive or negative? A. The slope is negative. As the independent variable increases the dependent variable also tends to increase. B. The slope is negative. As the independent variable increases the dependent variable tends to decrease. C. The slope is positive. As the independent variable increases the dependent variable also tends to increase. D. The slope is positive. As the independent variable increases the dependent variable tends to decrease.arrow_forwardI’m taking a statistics and probability class. Please get this correct because I want to learn. I have gotten wrong answers on here beforearrow_forwardplease use chart attatched. a. Explain the meaning of the slope of the regression line in this context. b. What is the predicted cost of maintenance for someone who racks up about 2,000 miles per month on a sedan? c. Suppose one of the observations used to get the data table above was a sedan owner who reported he drove 980 miles this month and spent about $450 on maintenance costs in the same month. What is the residual of this observation?arrow_forward
- Personal wealth tends to increase with age as older individuals have had more opportunitiesto earn and invest than younger individuals. The following data were obtained from a randomsample of eight individuals and records their total wealth (Y) and their current age (X). See attachment for table with figures State the estimated regression line and interpret the slope coefficient.b. What is the estimated total personal wealth when a person is 50 years old?c. What is the value of the coefficient of determination? Interpret it.d. Test whether there is a significant relationship between wealth and age at the 10%significance level. Perform the test using the following six steps.Step 1. Statement of the hypotheses Step 2. Standardised test statistic Step 3. Level of significance Step 4. Decision Rulearrow_forwardDevelop a scatterplot and explore the correlation between customer age and net sales by each type of customer (regular/promotion). Use the horizontal axis for the customer age to graph. Find the linear regression line that models the data by each type of customer. Round the rate of changes (slopes) to two decimal places and interpret them in terms of the relation between the change in age and the change in net sales. What can you conclude? Hint: Rate of Change = Vertical Change / Horizontal Change = Change in y / Change in xarrow_forwardCan you please check my workarrow_forward
arrow_back_ios
SEE MORE QUESTIONS
arrow_forward_ios
Recommended textbooks for you
- MATLAB: An Introduction with ApplicationsStatisticsISBN:9781119256830Author:Amos GilatPublisher:John Wiley & Sons Inc
 Probability and Statistics for Engineering and th...StatisticsISBN:9781305251809Author:Jay L. DevorePublisher:Cengage Learning
 Statistics for The Behavioral Sciences (MindTap C...StatisticsISBN:9781305504912Author:Frederick J Gravetter, Larry B. WallnauPublisher:Cengage Learning
  Elementary Statistics: Picturing the World (7th E...StatisticsISBN:9780134683416Author:Ron Larson, Betsy FarberPublisher:PEARSON
 The Basic Practice of StatisticsStatisticsISBN:9781319042578Author:David S. Moore, William I. Notz, Michael A. FlignerPublisher:W. H. Freeman
 Introduction to the Practice of StatisticsStatisticsISBN:9781319013387Author:David S. Moore, George P. McCabe, Bruce A. CraigPublisher:W. H. Freeman
MATLAB: An Introduction with Applications
Statistics
ISBN:9781119256830
Author:Amos Gilat
Publisher:John Wiley & Sons Inc
Probability and Statistics for Engineering and th...
Statistics
ISBN:9781305251809
Author:Jay L. Devore
Publisher:Cengage Learning
Statistics for The Behavioral Sciences (MindTap C...
Statistics
ISBN:9781305504912
Author:Frederick J Gravetter, Larry B. Wallnau
Publisher:Cengage Learning
Elementary Statistics: Picturing the World (7th E...
Statistics
ISBN:9780134683416
Author:Ron Larson, Betsy Farber
Publisher:PEARSON
The Basic Practice of Statistics
Statistics
ISBN:9781319042578
Author:David S. Moore, William I. Notz, Michael A. Fligner
Publisher:W. H. Freeman
Introduction to the Practice of Statistics
Statistics
ISBN:9781319013387
Author:David S. Moore, George P. McCabe, Bruce A. Craig
Publisher:W. H. Freeman