11.7. Machine speed. The number of defective items produced by a machine (Y) is known to be linearly related to the speed setting of the machine (X). The data below were collected from recent quality control records. i: 1 2 3 4 56 7 8 9 10 11 12 Xi: 200 400 300 400 200 300 300 400 200 400 200 300 Yi: 40 28 75 37 53 22 52 30 58 96 46 69
11.7. Machine speed. The number of defective items produced by a machine (Y) is known to be linearly related to the speed setting of the machine (X). The data below were collected from recent quality control records. i: 1 2 3 4 56 7 8 9 10 11 12 Xi: 200 400 300 400 200 300 300 400 200 400 200 300 Yi: 40 28 75 37 53 22 52 30 58 96 46 69

Functions and Change: A Modeling Approach to College Algebra (MindTap Course List)
6th Edition
ISBN:9781337111348
Author:Bruce Crauder, Benny Evans, Alan Noell
Publisher:Bruce Crauder, Benny Evans, Alan Noell
Chapter5: A Survey Of Other Common Functions
Section5.6: Higher-degree Polynomials And Rational Functions
Problem 1TU: The following fictitious table shows kryptonite price, in dollar per gram, t years after 2006. t=...

Related questions
Question
Please give handwritten
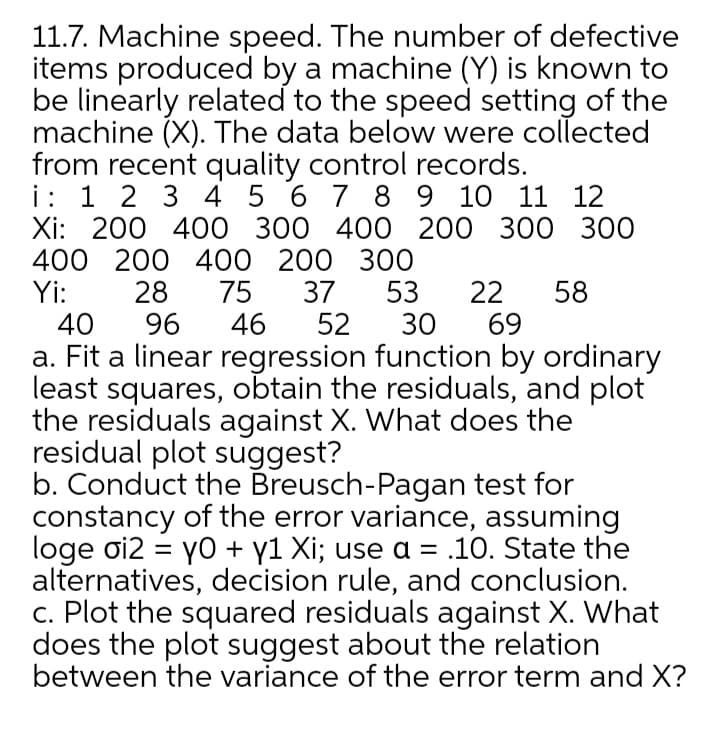
Transcribed Image Text:11.7. Machine speed. The number of defective
items produced by a machine (Y) is known to
be linearly related to the speed setting of the
machine (X). The data below were collected
from recent quality control records.
i: 1 2 3 4 5 6 7 8 9 10 11 12
Xi: 200 400 300 400 200 300 300
400 200 400 200 300
Yi:
40
28
96
75
46
37
52
53
30
22
69
58
a. Fit a linear regression function by ordinary
least squares, obtain the residuals, and plot
the residuals against X. What does the
residual plot suggest?
b. Conduct the Breusch-Pagan test for
constancy of the error variance, assuming
loge oi2 = yo + y1 Xi; use a = .10. State the
alternatives, decision rule, and conclusion.
c. Plot the squared residuals against X. What
does the plot suggest about the relation
between the variance of the error term and X?
Expert Solution
This question has been solved!
Explore an expertly crafted, step-by-step solution for a thorough understanding of key concepts.

This is a popular solution!

Trending now
This is a popular solution!

Step by step
Solved in 3 steps with 2 images

Recommended textbooks for you
Functions and Change: A Modeling Approach to Coll…
Algebra
ISBN:
9781337111348
Author:
Bruce Crauder, Benny Evans, Alan Noell
Publisher:
Cengage Learning

Algebra & Trigonometry with Analytic Geometry
Algebra
ISBN:
9781133382119
Author:
Swokowski
Publisher:
Cengage

Algebra and Trigonometry (MindTap Course List)
Algebra
ISBN:
9781305071742
Author:
James Stewart, Lothar Redlin, Saleem Watson
Publisher:
Cengage Learning
Functions and Change: A Modeling Approach to Coll…
Algebra
ISBN:
9781337111348
Author:
Bruce Crauder, Benny Evans, Alan Noell
Publisher:
Cengage Learning
Algebra & Trigonometry with Analytic Geometry
Algebra
ISBN:
9781133382119
Author:
Swokowski
Publisher:
Cengage
Algebra and Trigonometry (MindTap Course List)
Algebra
ISBN:
9781305071742
Author:
James Stewart, Lothar Redlin, Saleem Watson
Publisher:
Cengage Learning