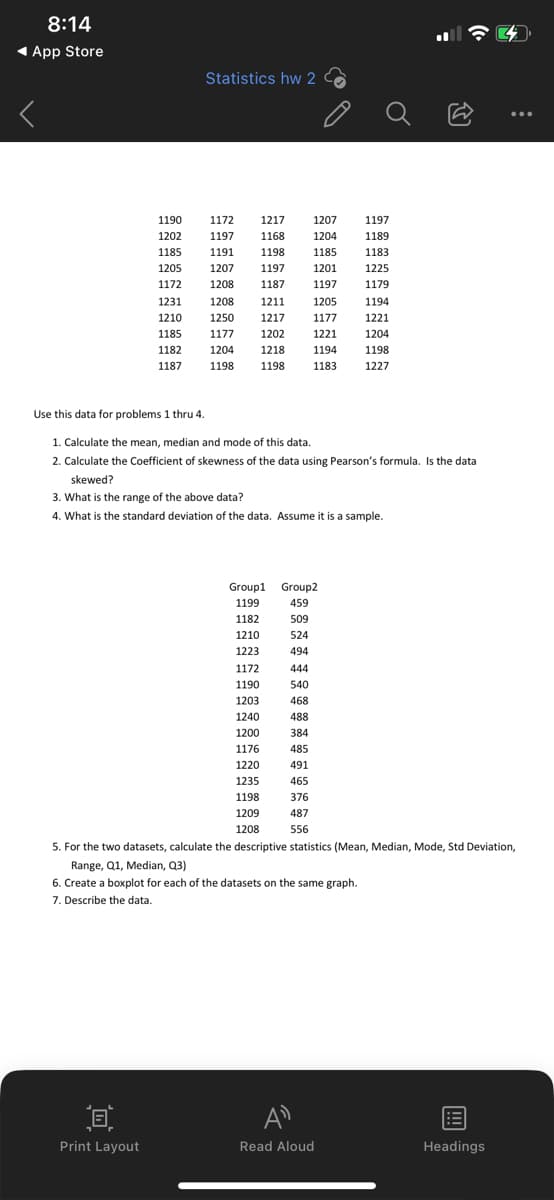
1190 1202 1172 1197 1185 1205 1172 1191 1207 1208 1231 1208 1210 1250 1185 1177 1182 1204 1187 1198 1217 1207 1168 1204 1198 1185 1197 1201 1187 1197 1205 1177 1221 1194 1183 1211 1217 1202 1218 1198 1197 1189 1183 1225 1179 1194 1221 1204 1198 1227 Use this data for problems 1 thru 4. 1. Calculate the mean, median and mode of this data. 2. Calculate the Coefficient of skewness of the data using Pearson's formula. Is the data skewed? 3. What is the range of the above data?
1190 1202 1172 1197 1185 1205 1172 1191 1207 1208 1231 1208 1210 1250 1185 1177 1182 1204 1187 1198 1217 1207 1168 1204 1198 1185 1197 1201 1187 1197 1205 1177 1221 1194 1183 1211 1217 1202 1218 1198 1197 1189 1183 1225 1179 1194 1221 1204 1198 1227 Use this data for problems 1 thru 4. 1. Calculate the mean, median and mode of this data. 2. Calculate the Coefficient of skewness of the data using Pearson's formula. Is the data skewed? 3. What is the range of the above data?

MATLAB: An Introduction with Applications
6th Edition
ISBN:9781119256830
Author:Amos Gilat
Publisher:Amos Gilat
Chapter1: Starting With Matlab
Section: Chapter Questions
Problem 1P

Related questions
Question
Transcribed Image Text:8:14
◄ App Store
1190
1202
1185
1205
1172
1231
1231
1210
1185
1182
1187
Use this data for problems 1 thru 4.
Print Layout
Statistics hw 2
1172 1217
1197
1168
1191
1198
1207 1197
1208
1187
1208
1250
1177
1204
1198
1211
1217
1202
1218
1198
Group1
1199
1182
1210
1223
***
1172
1190
1176
1220
1220
1235
1203
1240
1200
1. Calculate the mean, median and mode of this data.
2. Calculate the Coefficient of skewness of the data using Pearson's formula. Is the data
skewed?
3. What is the range of the above data?
4. What is the standard deviation of the data. Assume it is a sample.
1198
1209
1208
384
485
191
491
465
1207
1204
1185
1201
1197
Group2
459
509
524
494
444
540
468
488
376
376
487
556
1205
1177
1221
1194
1183
AD
Read Aloud
1197
1189
1183
1225
1179
1194
1221
1204
1198
1227
5. For the two datasets, calculate the descriptive statistics (Mean, Median, Mode, Std Deviation,
Range, Q1, Median, Q3)
6. Create a boxplot for each of the datasets on the same graph.
7. Describe the data.
...
Headings
Expert Solution
This question has been solved!
Explore an expertly crafted, step-by-step solution for a thorough understanding of key concepts.

Step by step
Solved in 6 steps with 9 images

Recommended textbooks for you
MATLAB: An Introduction with Applications
Statistics
ISBN:
9781119256830
Author:
Amos Gilat
Publisher:
John Wiley & Sons Inc

Probability and Statistics for Engineering and th…
Statistics
ISBN:
9781305251809
Author:
Jay L. Devore
Publisher:
Cengage Learning

Statistics for The Behavioral Sciences (MindTap C…
Statistics
ISBN:
9781305504912
Author:
Frederick J Gravetter, Larry B. Wallnau
Publisher:
Cengage Learning
MATLAB: An Introduction with Applications
Statistics
ISBN:
9781119256830
Author:
Amos Gilat
Publisher:
John Wiley & Sons Inc
Probability and Statistics for Engineering and th…
Statistics
ISBN:
9781305251809
Author:
Jay L. Devore
Publisher:
Cengage Learning
Statistics for The Behavioral Sciences (MindTap C…
Statistics
ISBN:
9781305504912
Author:
Frederick J Gravetter, Larry B. Wallnau
Publisher:
Cengage Learning

Elementary Statistics: Picturing the World (7th E…
Statistics
ISBN:
9780134683416
Author:
Ron Larson, Betsy Farber
Publisher:
PEARSON

The Basic Practice of Statistics
Statistics
ISBN:
9781319042578
Author:
David S. Moore, William I. Notz, Michael A. Fligner
Publisher:
W. H. Freeman

Introduction to the Practice of Statistics
Statistics
ISBN:
9781319013387
Author:
David S. Moore, George P. McCabe, Bruce A. Craig
Publisher:
W. H. Freeman