2. Suppose that the University of the West had the following data of its growth of enrollment from 2016-2014. Year Enrollment 2006 3000 2007 3200 2008 3600 2009 3650 2010 4000 2011 4200 2012 4300 2013 4410 2014 4520 a. Forecast the 2015 enrollment using three-year weighted moving average forecast. b. Using smooth a = 0.30, forecast the 2015 enrollment. c. Using MAD, solve for the forecasting error at a = 0.10
2. Suppose that the University of the West had the following data of its growth of enrollment from 2016-2014. Year Enrollment 2006 3000 2007 3200 2008 3600 2009 3650 2010 4000 2011 4200 2012 4300 2013 4410 2014 4520 a. Forecast the 2015 enrollment using three-year weighted moving average forecast. b. Using smooth a = 0.30, forecast the 2015 enrollment. c. Using MAD, solve for the forecasting error at a = 0.10

Practical Management Science
6th Edition
ISBN:9781337406659
Author:WINSTON, Wayne L.
Publisher:WINSTON, Wayne L.
Chapter13: Regression And Forecasting Models
Section: Chapter Questions
Problem 42P: The file P13_42.xlsx contains monthly data on consumer revolving credit (in millions of dollars)...

Related questions
Question
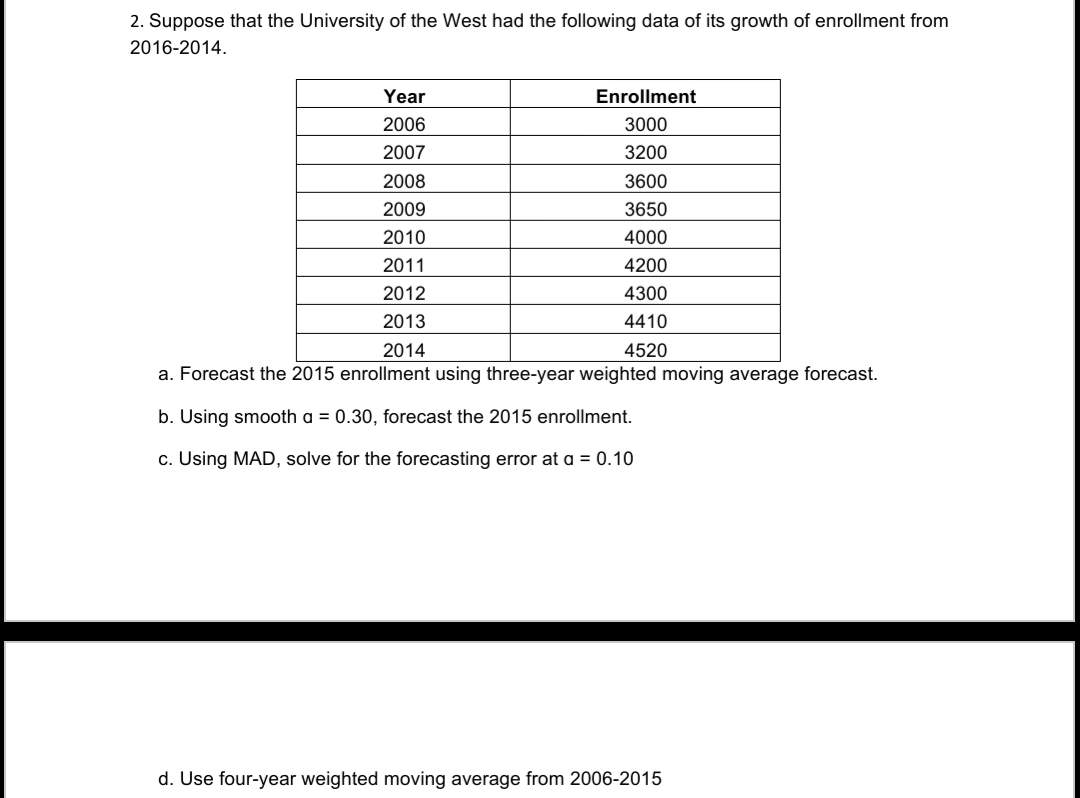
Transcribed Image Text:2. Suppose that the University of the West had the following data of its growth of enrollment from
2016-2014.
Year
Enrollment
2006
3000
2007
3200
2008
3600
2009
3650
2010
4000
2011
4200
2012
4300
2013
4410
2014
4520
a. Forecast the 2015 enrollment using three-year weighted moving average forecast.
b. Using smooth a = 0.30, forecast the 2015 enrollment.
c. Using MAD, solve for the forecasting error at a = 0.10
d. Use four-year weighted moving average from 2006-2015
Expert Solution
This question has been solved!
Explore an expertly crafted, step-by-step solution for a thorough understanding of key concepts.

This is a popular solution!

Trending now
This is a popular solution!

Step by step
Solved in 2 steps with 3 images

Recommended textbooks for you
Practical Management Science
Operations Management
ISBN:
9781337406659
Author:
WINSTON, Wayne L.
Publisher:
Cengage,

Contemporary Marketing
Marketing
ISBN:
9780357033777
Author:
Louis E. Boone, David L. Kurtz
Publisher:
Cengage Learning

Marketing
Marketing
ISBN:
9780357033791
Author:
Pride, William M
Publisher:
South Western Educational Publishing
Practical Management Science
Operations Management
ISBN:
9781337406659
Author:
WINSTON, Wayne L.
Publisher:
Cengage,
Contemporary Marketing
Marketing
ISBN:
9780357033777
Author:
Louis E. Boone, David L. Kurtz
Publisher:
Cengage Learning
Marketing
Marketing
ISBN:
9780357033791
Author:
Pride, William M
Publisher:
South Western Educational Publishing