60 60 50 50 40 40 30 30 20 20 10- 10- 10 20 30 40 50 60 x 10 20 30 40 50 60 A b. What does the scatter diagram developed in part (a) indicate about the relationship between the two variables? There appears to be a negative : linear relationship between x and y. c. Try to approximate the relationship between x and y by drawing a straight line through the data. Only one straight line can be drawn * to provide a linear approximation of the relationship between x and y. d. Develop the estimated regression equation by computing the values of bo and bị using equations: (Enter negative values as negative figure) - 7)(yi – 9) b1 = (x; – 7)? bo = y – bị a 77.68 + 2.96 x (to 2 decimals) e. Use the estimated regression equation to predict the value of y when x = 6. ü = 95.44 (to 2 decimals)
60 60 50 50 40 40 30 30 20 20 10- 10- 10 20 30 40 50 60 x 10 20 30 40 50 60 A b. What does the scatter diagram developed in part (a) indicate about the relationship between the two variables? There appears to be a negative : linear relationship between x and y. c. Try to approximate the relationship between x and y by drawing a straight line through the data. Only one straight line can be drawn * to provide a linear approximation of the relationship between x and y. d. Develop the estimated regression equation by computing the values of bo and bị using equations: (Enter negative values as negative figure) - 7)(yi – 9) b1 = (x; – 7)? bo = y – bị a 77.68 + 2.96 x (to 2 decimals) e. Use the estimated regression equation to predict the value of y when x = 6. ü = 95.44 (to 2 decimals)

Glencoe Algebra 1, Student Edition, 9780079039897, 0079039898, 2018
18th Edition
ISBN:9780079039897
Author:Carter
Publisher:Carter
Chapter4: Equations Of Linear Functions
Section: Chapter Questions
Problem 8SGR

Related questions
Question
Transcribed Image Text:60
60-
50
50
40
40
30
30
20
10
10-
10
20
30
40
50
60 x
10
20
30
40
50
60 x
A
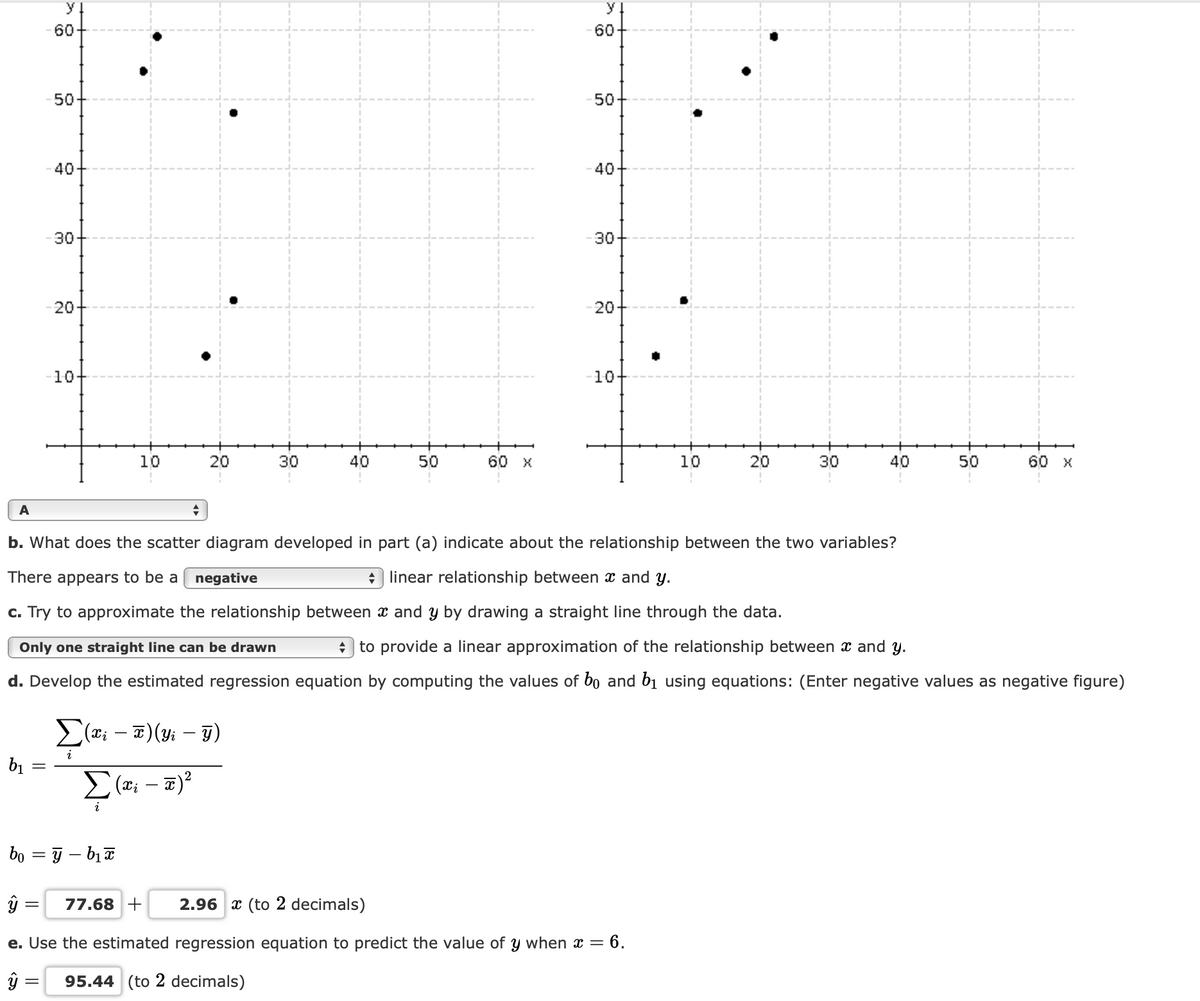
b. What does the scatter diagram developed in part (a) indicate about the relationship between the two variables?
There appears to be a
negative
+ linear relationship between x and y.
c. Try to approximate the relationship between x and y by drawing a straight line through the data.
Only one straight line can be drawn
+) to provide a linear approximation of the relationship between x and y.
d. Develop the estimated regression equation by computing the values of bo and b1 using equations: (Enter negative values as negative figure)
E(t; – 7)(y: – T)
i
bị
bo = y – bịE
77.68 +
2.96 x (to 2 decimals)
e. Use the estimated regression equation to predict the value of y when x =
= 6.
95.44 (to 2 decimals)
20
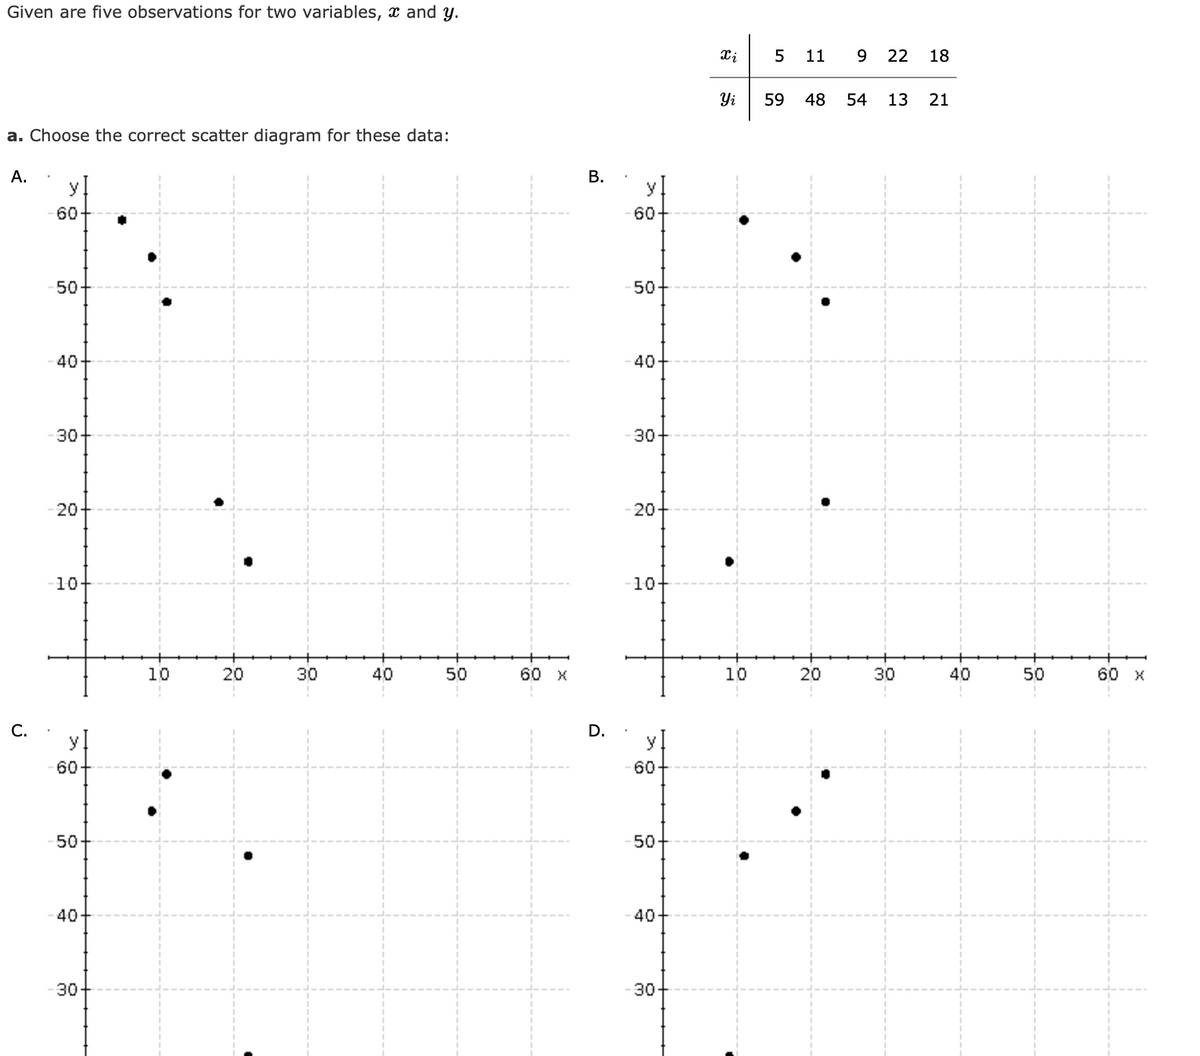
Transcribed Image Text:Given are five observations for two variables, x and y.
11
9.
22
18
Yi
59
48
54
13
21
a. Choose the correct scatter diagram for these data:
A.
y
y
60
60
50
50
40
40
30
30
-20
20
10+
10
10
20
30
40
50
60 X
10
20
30
40
50
60 x
C.
D.
y
y
60
60
50
50
40
40
30
30
B.
Expert Solution
This question has been solved!
Explore an expertly crafted, step-by-step solution for a thorough understanding of key concepts.

Step by step
Solved in 3 steps with 3 images

Recommended textbooks for you
Glencoe Algebra 1, Student Edition, 9780079039897…
Algebra
ISBN:
9780079039897
Author:
Carter
Publisher:
McGraw Hill
Glencoe Algebra 1, Student Edition, 9780079039897…
Algebra
ISBN:
9780079039897
Author:
Carter
Publisher:
McGraw Hill