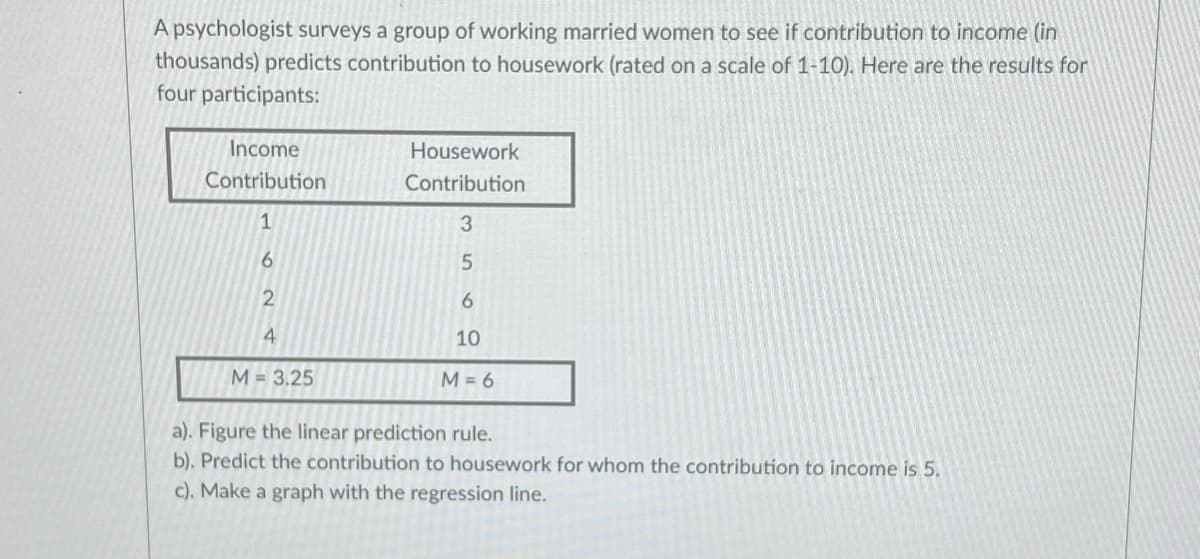
A psychologist surveys a group of working married women to see if contribution to income (in thousands) predicts contribution to housework (rated on a scale of 1-10). Here are the results for four participants: Income Housework Contribution Contribution 3. 6. 6. 4. 10 M= 3.25 M = 6 a). Figure the linear prediction rule. b). Predict the contribution to housework for whom the contribution to income is 5. c). Make a graph with the regression line.


Q: There is some evidence that, in the years −198185 , a simple name change resulted in a short-term…
A: μ±2σGiven , μ=0.89 , σ=0.16∴ μ-2σ,μ+2σ=0.57,1.21
Q: a consumer analyst collected the following data on the screen sizes of popular LCD televisions sold…
A: Given observation and calculation is shown below
Q: The following table gives the total number of people fully vaccinated in Oklahoma over a window of…
A: Note:- Since you have posted a question with multiple sub-parts, we will solve first three sub-…
Q: There is some evidence that, in the years 1981— 85, a simple name change resulted in a short-term…
A:
Q: What statistical procedure would you use to predict length of jump using height? Give reasons.…
A: A.) THE STATISTICAL PROCEDURE THAT WE COULD USE TO PREDICT LENGTH OF JUMP USING HEIGHT IS 'LINEAR…
Q: The following measurements are recorded as propagation delay of a certain transmission tower located…
A: Given data The following measurements are recorded as propagation delay 15.378 , 17.625 , 18.013 ,…
Q: he heights in centimeters of a sample of a species of 30 days after sprouting below 22.7 21.9 22.3…
A: The data is quantitative because it takes all the numeric values and measures by scale.
Q: To compare textbook prices at the two most popular online booksellers, a Statistics student gathered…
A: Correlation: Correlation a measure which indicates the “go-togetherness” of two data sets. It can be…
Q: The manager of a fleet of automobiles is testing two brands of radial tires. He assigns one tire of…
A: Given : Brand 1 Brand 2 34900 36700 45500 47200 37100 37700 32000 31400 48900 47800…
Q: The article "Vehicle-Arrival Characteristics at Urban Uncontrolled Intersections" (V. Rengaraju and…
A: a. The following procedure is used to find out the regression equation for predicting the y using x1…
Q: Consider the dreaded disease Dipsidoodleitis. There are actually two forms of the disease, Type I…
A: Let us denote Dipsildoodleitis disease by D Let us denote Type 1 form of the disease by T1 and type…
Q: Using the source and destination information below, what is the cost in the initial solution using…
A: North-West Corner Method (NWCM) Steps (Rule) Step-1: Select the upper left corner cell of the…
Q: Estimate the following specification, ỹ = bo + bị * x, given the following data y 3. 6. 13 9. 15 12…
A: Since you have posted a question with multiple sub-parts, we will solve first three sub- parts for…
Q: There is some evidence that, in the years 1981 – 85, a simple name change resulted in a short-term…
A: Consider that a random variable X has expected value μ and standard deviation, σ. Now, according to…
Q: Use the table to calculate the 80 % prediction interval for y at zo = 20 3 22 4 23 29 27 29 8. 31
A: Given: x y 3 22 4 23 5 29 6 27 7 29 8 31
Q: As part of a study designed to compare hybrid and similarly equipped conventional vehides, Consumer…
A: For the given data using Anova: Two-Factor With Replication carry out the hypotheses at alpha…
Q: In the following data, a is the average number of hours the student spent working on math each week…
A: Given Y = 3.02X + 39.28 Find grade if X = 10
Q: In Sperling's experiment, people were shown a 3 x 4 array of letters for 50 milliseconds. Regardless…
A:
Q: The two dot plots below compare the forearm lengths of two groups of schoolchildren: Forearm Length,…
A: According to the provided information, forearm length of two groups of school children are given.…
Q: In the article “Evaluation of Low-Temperature Properties of HMA Mixtures”, the following values of…
A: Given that n=24
Q: The article "Estimating Population Abundance in Plant Species with Dormant Life-Stages: Fire and the…
A: "Since you have posted a question with multiple sub-parts, we will solve first three sub-parts for…
Q: The table presents gasoline mileage performance for 25 automobiles (Source: Motor Trend, 1975). Y X1…
A: Enter the data into the excel sheet as follows: Let's code A as 1 and M as 0 in column L under X11…
Q: A researcher is interested in whether color-blind individuals can distinguish gray shades better…
A: Given: A researcher is interested in whether color-blind individuals can distinguish gray shades…
Q: Find the predicted value of c in terms of c,,c, the predicted value of c, and the estimated value of…
A: Given information: The investigator is specially interested to forecast future value using moving…
Q: The table shows the results of a cross tabulation of gender and whether a person is happy in his or…
A: To determine whether the two variables are independent or not, the test of independence needs to be…
Q: There is some evidence that, in the years −198185 , a simple name change resulted in a short-term…
A: Note: Hi there! Thank you for posting the question. As there are multiple sub parts, according to…
Q: The tollowing is data for the tirst and second Quiz Scores for 8 students in First Quiz Second Quiz…
A: Given,
Q: The table below shows data for the population of the United States year U.S. Population…
A:
Q: Suppose that a customer is purchasing a car. He conducts an experiment in which he puts 10 gallons…
A: Solution: Note: Hello! As you have posted more than 3 sub parts, we are answering the first 3…
Q: The following is data for the first and second Quiz scores for 8 students in a class. First Quiz…
A:
Q: Given below is data about total mevenues Speofit fox the quader 4ome companies Calulate dul Corsonis…
A: From the given data
Q: ost per serving (in cents) for six high-fiber cereals rated very good and for nine high-fiber…
A:
Q: Suppose a doctor is monitoring cancer cells in a patient in order to initiate curative treatment…
A: the domain is {0,2,4,6,8,10,12,14,16,18,20} The range is…
Q: The table below gives the percent of U.S. seniors (aged 65+ years) who used the internet in selected…
A: Excel Procedure: Enter Year and % of U.S senior using internet data in Excel Go to Data Click on…
Q: The cross-tabulation data given below show the number of people who rated a customer service…
A: Given that Observed Frequencies B1 B2 Total A1 13 4 17 A2 16 20 36 Total 29 24 53 need…
Q: fat 19 31 34 35 39 39 43 Calories 410 580 590 570 640 680 660 According to the following data,…
A: Given the values of Fat(Y) and calories(X) let fat be the dependent variable and calories be the…
Q: The following is data for the first and second Quiz scores for 8 students in a class. First Quiz…
A: Here, First Quiz (Q1) is the independent variable and the Second Quiz (Q2) is the dependent…
Q: There is some evidence that, in the years−198185, a simple name change resulted in a short-term…
A: The given information is: Meanμ=0.86 Standard deviationσ=0.10 Suppose X is a random variable…
Q: The following data are the heights of 40 students in a statistics class: 59; 60; 61; 62; 62; 63; 63;…
A: Solution-: Given data:…
Q: The following table shows the number of hours some high school students in 2 cities spend watching…
A:
Q: Estimate u, from the following incomplete data X 3 4 5 7 13 21 37 State the necessary assumption…
A:
Q: 1la With the aid of simple diagrams, explain the types of skewness. b Calculate the skewness for the…
A: 11 (a) Skewness Skewness is an asymmetry or distortion in a collection of data that deviates from…
Q: fat 19 31 34 35 39 39 43 calories 410 580 590 570 640 680 660 According to the following data,…
A: Solution: The data for fat and calories is given. The formula for the line of best fit is required…
Q: A survey of 2,510 golfers showed that 311 of them are left-handed. Find a point estimate for p,…
A:
Q: 1. Find the degree of skewness of the following sets of data: a. Height of Students in cm: 126 134…
A: Since you have asked multiple question, we will solve the first question for you. If you want any…
Q: A group of 2000 individuals from 3 different cities were asked whether they owned a foreign or a…
A: Solution: The Expected frequency table Type of car Detroit Atlanta Denver Total Domestic…
Q: An article in Technometrics (1999, Vol. 41, pp. 202-211) studied the capability of a gauge by…
A:
Q: Assume the height of students are normally distributed, do boys and girls differ in height in one…
A:
Q: When the light turns yellow, should you stop or go through it? The article “Evaluation of Driver…
A:


Trending now
This is a popular solution!

Step by step
Solved in 4 steps with 1 images


- If the data analyst hypothesizes that grocery sales are higher when payment is made using credit cards compared to cash payment, the null hypothesis would likely state that grocery sales are lower when payment is made using credit cards compared to cash payment. T/FIn terms of the model parameters, state the null hypothesis that, after controlling for sales and roe, ros has no effect on CEO salary. State the alternative that better stock market performance increases a CEO’s salary.The maximum discount value of the Entertainment® card for the “Fine Dining” section, Edition 10, for various pages is given below. Page number Maximum value ($)4 1614 1925 1532 1743 1957 1572 1685 1590 17a) Decide which variable should be the independent variable and which should be the dependent variable. Justify your choice. b) Draw a scatter plot of the ordered pairs. c) Does it appear that the restaurants giving the maximum value are placed in the beginning of the “Fine Dining” section? How did you arrive at your answer? d) What is the slope of the least squares (best-fit) line? Interpret the slope. e) What is the intercept of the least squares (best-fit) line? Interpret the intercept. f) Write down the equation for the least squares line. Interpret your equation. g) Find the estimated maximum…
- Large companies typically collect volumes of data before designing a product, not only to gain information as to whether the product should be released, but also to pinpoint which markets would be the best targets for the product. Several months ago, I was interviewed by such a company while shopping at a mall. I was asked about my exercise habits and whether or not I'd be interested in buying a video/DVD designed to teach stretching exercises. I fall into the male, 18-35-years-old category, and I guessed that, like me, many males in that category would not be interested in a stretching video. My friend Holly falls in the female, older-than-35 category, and I was thinking that she might like the stretching video. After being interviewed, I looked at the interviewer's results. Of the 89 people in my market category who had been interviewed, 20 said they would buy the product, and of the 103 people in Holly's market category, 28 said they would buy it. Assuming that these…Use this data and create a model that estimates a student's giving rate as an alumni based on the three parameters provided. If a class has a graduation rate of 74, the % of classes under 20 student equal to 55, and a Student=Faculty Ratio of 19, what should we expect our Alumni Giving Rate to be? (Enter a whole number) University Graduation Rate % of Classes Under 20 Student-Faculty Ratio Alumni Giving Rate Boston College 85 39 13 25 Brandeis University 79 68 8 33 Brown University 93 60 8 40 California Institute of Technology 85 65 3 46 Carnegie Mellon University 75 67 10 28 Case Western Reserve Univ. 72 52 8 31 College of William and Mary 89 45 12 27 Columbia University 90 69 7 31 Cornell University 91 72 13 35 Dartmouth College 94 61 10 53 Duke University 92 68 8 45 Emory University 84 65 7 37 Georgetown University 91 54 10 29 Harvard University 97 73 8 46 Johns Hopkins University 89 64 9 27 Lehigh University 81 55 11 40 Massachusetts Inst.…In forestry, the diameter of a tree at breast height is used to model the height of the tree. Silviculturists working in British Columbia’s boreal forest conducted a series of spacing trials to predict the heights of several species of trees. The data are the breast height diameters (in centimeters) and heights (in meters) for a sample of 18 white spruce trees. B1 B2 18.9 20.0 15.5 16.8 19.4 20.2 20.0 20.0 29.8 20.2 19.8 18.0 20.3 17.8 20.0 19.2 22.0 22.3 16.6 18.8 15.5 16.9 13.7 16.3 27.5 21.4 20.3 19.2 22.9 19.8 14.1 18.5 10.1 12.1 5.8 8.0 B1: Breast Height Diameter of White spruce (cm) B2: Height (m) a) Plot the relationship using scatter diagram between the breast height diameters and the trees’ height. Are the breast height diameters and the trees’ height linearly related? What can you infer about the relationship between the two variables? Is a linear model appropriate? b) Compare the scatter plot in (a) with the correlation coefficient…
- Large companies typically collect volumes of data before designing a product, not only to gain information as to whether the product should be released, but also to pinpoint which markets would be the best targets for the product. Several months ago, I was interviewed by such a company while shopping at a mall. I was asked about my exercise habits and whether or not I'd be interested in buying a video/DVD designed to teach stretching exercises. I fall into the male, 18 – 35-years-old category, and I guessed that, like me, many males in that category would not be interested in a stretching video. My friend Diane falls in the female, older-than-35 category, and I was thinking that she might like the stretching video. After being interviewed, I looked at the interviewer's results. Of the 93 people in my market category who had been interviewed, 17 said they would buy the product, and of the 113 people in Diane's market category, 34 said they would buy it. Assuming that these data came…Large companies typically collect volumes of data before designing a product, not only to gain information as to whether the product should be released, but also to pinpoint which markets would be the best targets for the product. Several months ago, I was interviewed by such a company while shopping at a mall. I was asked about my exercise habits and whether or not I'd be interested in buying a video/DVD designed to teach stretching exercises. I fall into the male, 18 – 35-years-old category, and I guessed that, like me, many males in that category would not be interested in a stretching video. My friend Amanda falls in the female, older-than-35 category, and I was thinking that she might like the stretching video. After being interviewed, I looked at the interviewer's results. Of the 97 people in my market category who had been interviewed, 16 said they would buy the product, and of the 101 people in Amanda's market category, 31 said they would buy it. Assuming that these data came…The maximum discount value of the Entertainment® card for the “Fine Dining”section, Edition 10, for various pages is given below. Page number Maximum value ($)4 1614 1925 1532 1743 1957 1572 1685 1590 17What is the slope of the least squares (best-fit) line? Interpret the slope. What is the intercept of the least squares (best-fit) line? Interpret theintercept.
- A researcher is examining the effect of neighborhood crime-watch efforts have on the crime rate in those neighborhoods, but he is not sure what direction the relationship might be; neighborhoods with high crime rates might have more crime watch efforts that are an attempt to address the high level of crime, or neighborhoods with high crime rates may have fewer crime watch efforts, which might explain why they have so much crime. The appropriate hypothesis test would be:Refer to Exercise 7. Assume that p = 4.3 ± 0.1 cm and q = 2.1 ± 0.2 cm. Estimate f, and find the relative uncertainty in the estimate.On the Great Stark island, the likelihood of a residential fire is evenly distributed at 12 per month. Residents are evenly distributed along the 64-mile perimeter of the island. The government is providing fire protection, and a fire department's fixed cost is $60,000 per month. If the travel cost to fight a fire is $2,500 per mile, what is the optimal number of fire departments?