9. a. Obtain the linear trend equation for the following data on new checking accounts at Fair Sav Bank and use it to predict expected new checking accounts for periods 16 through 19. Period New Accounts Period New Accounts Period New Accounts 200 232 11 281 214 248 12 275 3. 211 8. 250 13 280 4. 228 253 14 288 235 10 267 15 310 b. Use trend-adjusted smoothing with a = .3 and B = .2 to smooth the new account data in par What is the forecast for period 16? %3D
Q: (a) Apply the moving average (MA) model with a three-day lag (q = 3) and a five-day lag (q =5) to…
A: THE ANSWER IS AS BELOW:
Q: Weekly sales of copy paper at Cubicle Suppliers are in the table below. Compute a three- period…
A: This question is related to the topic -Forecasting and this topic would fall under the business…
Q: Simple exponential smoothing with α= 0.3 is being used to forecast sales of digital cameras at…
A: Given Information: Sales in September: 120 units Forecast in September: 100 units Alpha = 0.3…
Q: Demand for oil changes at Garcia’s Garage has been as follows:Month Number of Oil…
A: The following dialogue box will appear. Enter the data and click on OK.
Q: Quesiton-4 Weekly demand for dry pasta at a supermarket chain is as follows (Marks-03) Week…
A: 1. Forecast the demand for week 11 by using a five-period moving average. Average of the past 5 data…
Q: Data collected on the yearly registrations for a Six Sigma seminar at the Quality College are shown…
A: Formula used- 3-period moving average forecast=At-1+At-2+At-33 3-period weighted moving average…
Q: In the Atlanta area, the number of daily calls for the repair of Speedy copy machines has been…
A: Given data-
Q: a) b) would have applied the Naïve Model, calculate the Naïve Forecast values for the months of…
A: Answers of all parts is below:-
Q: Thamer Almutairi, owner of Almutairi's DepartmentStore, has used time-series extrapolation to…
A: Given data
Q: Consider the following time series data. Week 1 2 3 4 5 6 Value 18 13 16 11 17 14 a. Construct a…
A: Given information Week Value 1 18 2 13 3 16 4 11 5 17 6 14
Q: Data collected on the yearly registrations for a Six Sigma seminar at the Quality College are shown…
A: Forecasting is the process of estimation in which future demand is determined using previous or…
Q: Determine the Running Sum of Forecast Errors (RSFE), the Mean Absolute Deviation, MADt-1,and the…
A: Forecasting is the process of predicting future demand based on previous or historic information and…
Q: d) Calculate the trend projection with regression forecast for periods 7 through 10. The regression…
A: Forecasting is the ability to predict future happenings using different forecasting methods.
Q: 1. Consider the total production (and sales) of ice cream in Canada (in millions of liters) for the…
A: We are authorized to answer three subparts at a time since you have not mentioned which part you are…
Q: 2. National Scan, Inc., sells radio frequency inventory tags. Monthly sales for a seven- month…
A: Here, from the question, I have got the tabulated data, for this data, I have applied various…
Q: Consider the following time series data. Week 1 2 3 4 5 6 Value 18 13 16 11 17 14 a. Use α = 0.2 to…
A:
Q: 1. Solve manually. a. Income at the law firm Smith and Wesson for the period February to July was as…
A: Regression is a statistical technique used in finance, investing, and other fields to identify the…
Q: George kyparisis owns a company that manufactures sailboats. Actual demand for Georges's sailboats…
A: Given data is
Q: The following tabulations are actual sales of units for six months and a starting forecast in…
A:
Q: Income at the architectural firm Spraggins and Yunes for the period February to July was as follows:…
A: The formula to be used in Trend smoothing, Tt is Tt+1= Tt + beta*(Ft+1 – FITt)
Q: We are predicting quarterly sales for soda at Gordon’sLiquor Store using Winter’s method. We are…
A:
Q: Freight car loadings over an 18-week period at a busy port are as follows: Weeks Loadings (lbs)…
A: Let X denotes the week and Y denotes the number. Now calculate the following:
Q: A coffee shop owner wants to estimate demand for the next four quarters for hot chocolate. Sales…
A: Given, Quarter 1- 1.20 Quarter 2- 1.15 Quarter 3- 0.77 Quarter 4- 0.88
Q: Consider the total production (and sales) of ice cream in Canada (in millions of liters) for the…
A: Since we only answer up to 3 sub-parts, we will answer the first 3. Please resubmit the question and…
Q: 14. Consider the following time series. t 1 2 3 4 5 7 Yt 120 110 100 96 94 92 88 a. Construct a time…
A: Given Information: a) The time series plot for the given series is as follows: The curvilinear…
Q: Sales of industrial vacuum cleaners at Larry Armstrong Supply Co. over the past I 3 months are shown…
A: Note: As per the Bartleby guidelines only the first three parts have been answered.
Q: 6) 4 Consider the following time series data. Month 1 2 3 4 5 6…
A: Hi, we are supposed to answer 3 subparts at a time. Since you have not mentioned which subpart to…
Q: Quarterly demand for Ford F150 pickups at a New York autodealer is forecast with the equation:yn =…
A: Given data Where, X= quarters Yn= Quarterly demand Quarter I of year 1 is 0 Quarter II of year 1…
Q: Consider the following from an estate agent’s business nationally: Month Houses Sold Jan 380…
A: Since you have submitted multiple questions, as per guidelines I have answered the first question…
Q: 25. Determine the following: a. The value of a consistent with N = 6 in moving averages. b. The…
A:
Q: The following are sales revenues for a large utility company for years 1 through 11. Forecast…
A: Year ( X ) REVENUE ( Y ) XY X2 1 4875.0 4875 1 2 5065.7 10131.4 4 3 5523.4 16570.2 9…
Q: Café Michigan's manager, Gary Stark, suspects that demand for mocha latte coffees depends on the…
A: Price (x) Number Sold (y) xy x2 $2.70 760 2052 7.29 $3.40 515 1751 11.56 $2.10 990 2079 4.41…
Q: Use the data below to solve for the following: 2. Naïve method 3. Unweighted 3 month moving average…
A: 2. Naïve techniqueThe simplest form of forecasting, the naive method forecasts that the value in the…
Q: Consider the following time series data: Month Value 24 13 20 12 19 23 15 a.…
A: Given data is
Q: The Victory Plus Mutual Fund of growth stocks has had the following average monthly price forthe…
A: Month Price 1 62.7 2 63.9 3 68 4 66.4 5 67.2 6 65.8 7 68.2 8 69.3 9 67.2 10…
Q: MGMT2026 Production and Operations Management The number of students enrolled in Spring Valley…
A:
Q: The manager of a utility company in the Texas panhandle wants to develop quarterly forecasts of…
A: Seasonal index = season demand / average yearly demand Seasonal index when multiple periods are…
Q: a. What is your forecast for December of Year 4, making period 1 as the starting period for the…
A: a) Period Demand Square of X Multiplication of x and y, XY 1 4507 1 4507 2 4400 4 8800…
Q: Income at the architectural firm Spraggins andYunes for the period February to July was as follows:…
A: Foretasted Income at time t Ft= FIT (t−1) +α(A(t−1)−FIT (t−1) ) Trend at time t…
Q: A check-processing center uses exponetial smoothing to forecast the number of incoming checks each…
A: Given, Checks received in June = 40 million Forecast for June = 42 million Smoothing Constant = 0.15
Q: Demand for oil changes at Garcia's Garage has been as follows: IT Month Number of Oil Changes…
A: Linear Regression Month Month ( X ) No. of oil changes ( Y ) XY X2 Jan 1 39 39 1 Feb…
Q: The following table gives the number of pints of type A blood used at Damascus Hospital in the past…
A: A. Forecasted demand for the week of October 12 using a 3-week moving average method =Pints used for…
Q: The forecast for Monday was derived by observing Monday's demand level and setting Monday's forecast…
A: WE ARE GIVEN WITH ACTUAL DEMAND AND FORECAST DEMAND OF MONDAY TO THURSDAY. WE ARE TO FIND FORECAST…
Q: 2. Suppose that the University of the West had the following data of its growth of enrollment from…
A: Since you have posted a question with multiple sub-parts, we will solve first three sub-parts for…
Q: Consider the following actual and forecast demand levels for Big Mac hamburgers at a local…
A: Let, Ft+1 = Forecast for friday Yt = 48.00 Ft = 77.60 α = 0.40 Thus expression for the forecast for…
Q: Consider the following time series data. Week 1 2 3 4 5 6 Value 19 14 16 12 17 15 A. Develop the…
A:
Q: The values of Alabama building contracts (in millions of dollar) for a 12-month period are in the…
A: THE ANSWER IS AS BELOW:
Q: i. Prepare a forecast for year 5 through 8 by using a three-year simple moving average. What is the…
A: i) forecast for year 9- by using a three-year simple moving average, forecast for year 9 = year 6 +…
Q: ractice Problem: Usins the data on a hospital’s revenue: (1) Use simple exponential smoothing to…
A: Ft=α At-1 + (1-α) Ft-1Ft =Forecast of period tAt-1=Previous period demand Ft-1=Previous period…
Q: The Victory Plus Mutual Fund of growth stocks has had the following average monthly price for the…
A: Note: - Since we can answer only up to three subparts we will answer the first three(1, 2, and 3)…
help please I need it in excel
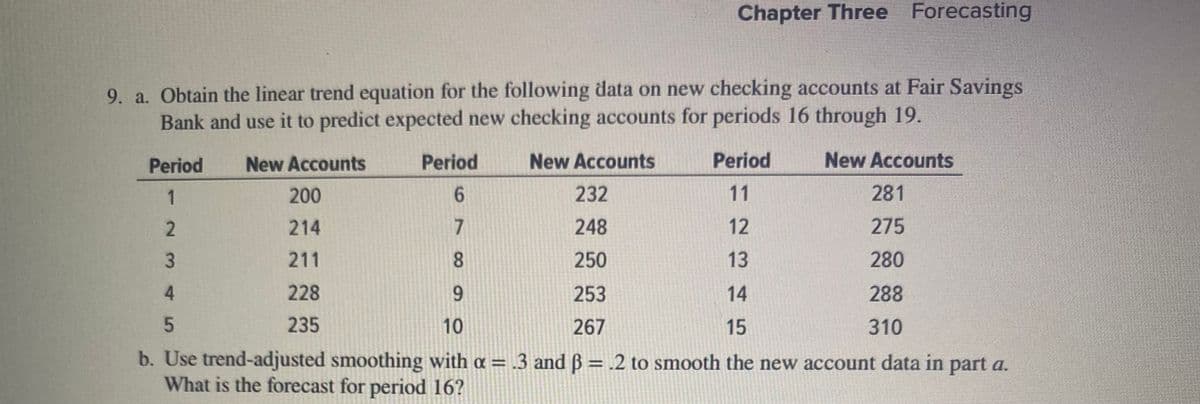
Trending now
This is a popular solution!
Step by step
Solved in 5 steps with 3 images
- Under what conditions might a firm use multiple forecasting methods?The file P13_42.xlsx contains monthly data on consumer revolving credit (in millions of dollars) through credit unions. a. Use these data to forecast consumer revolving credit through credit unions for the next 12 months. Do it in two ways. First, fit an exponential trend to the series. Second, use Holts method with optimized smoothing constants. b. Which of these two methods appears to provide the best forecasts? Answer by comparing their MAPE values.The Baker Company wants to develop a budget to predict how overhead costs vary with activity levels. Management is trying to decide whether direct labor hours (DLH) or units produced is the better measure of activity for the firm. Monthly data for the preceding 24 months appear in the file P13_40.xlsx. Use regression analysis to determine which measure, DLH or Units (or both), should be used for the budget. How would the regression equation be used to obtain the budget for the firms overhead costs?
- The file P13_26.xlsx contains the monthly number of airline tickets sold by the CareFree Travel Agency. a. Create a time series chart of the data. Based on what you see, which of the exponential smoothing models do you think will provide the best forecasting model? Why? b. Use simple exponential smoothing to forecast these data, using a smoothing constant of 0.1. c. Repeat part b, but search for the smoothing constant that makes RMSE as small as possible. Does it make much of an improvement over the model in part b?The file P13_29.xlsx contains monthly time series data for total U.S. retail sales of building materials (which includes retail sales of building materials, hardware and garden supply stores, and mobile home dealers). a. Is seasonality present in these data? If so, characterize the seasonality pattern. b. Use Winters method to forecast this series with smoothing constants = = 0.1 and = 0.3. Does the forecast series seem to track the seasonal pattern well? What are your forecasts for the next 12 months?The file P13_28.xlsx contains monthly retail sales of U.S. liquor stores. a. Is seasonality present in these data? If so, characterize the seasonality pattern. b. Use Winters method to forecast this series with smoothing constants = = 0.1 and = 0.3. Does the forecast series seem to track the seasonal pattern well? What are your forecasts for the next 12 months?
- The file P13_22.xlsx contains total monthly U.S. retail sales data. While holding out the final six months of observations for validation purposes, use the method of moving averages with a carefully chosen span to forecast U.S. retail sales in the next year. Comment on the performance of your model. What makes this time series more challenging to forecast?The owner of a restaurant in Bloomington, Indiana, has recorded sales data for the past 19 years. He has also recorded data on potentially relevant variables. The data are listed in the file P13_17.xlsx. a. Estimate a simple regression equation involving annual sales (the dependent variable) and the size of the population residing within 10 miles of the restaurant (the explanatory variable). Interpret R-square for this regression. b. Add another explanatory variableannual advertising expendituresto the regression equation in part a. Estimate and interpret this expanded equation. How does the R-square value for this multiple regression equation compare to that of the simple regression equation estimated in part a? Explain any difference between the two R-square values. How can you use the adjusted R-squares for a comparison of the two equations? c. Add one more explanatory variable to the multiple regression equation estimated in part b. In particular, estimate and interpret the coefficients of a multiple regression equation that includes the previous years advertising expenditure. How does the inclusion of this third explanatory variable affect the R-square, compared to the corresponding values for the equation of part b? Explain any changes in this value. What does the adjusted R-square for the new equation tell you?The file P13_02.xlsx contains five years of monthly data on sales (number of units sold) for a particular company. The company suspects that except for random noise, its sales are growing by a constant percentage each month and will continue to do so for at least the near future. a. Explain briefly whether the plot of the series visually supports the companys suspicion. b. By what percentage are sales increasing each month? c. What is the MAPE for the forecast model in part b? In words, what does it measure? Considering its magnitude, does the model seem to be doing a good job? d. In words, how does the model make forecasts for future months? Specifically, given the forecast value for the last month in the data set, what simple arithmetic could you use to obtain forecasts for the next few months?
- Explain the trade-off between responsiveness and stability in a forecasting system that uses time-series data. Who needs to be involved in preparing forecasts? 3. How has technology had an impact on forecasting? What capability would an organization have to have to not need forecasts? Give three examples of unethical conduct involving forecasting and the ethical principle each violatesTwo different forecasting techniques (F1 and F2) were used to forecast demand for cases of bottled water. Actual demand and the two sets of forecasts are as follows: PREDICTED DEMANDPeriod Demand F1 F21 68 66 662 75 68 683 70 72 704 74 71 725 69 72 746 72 70 767 80 71 788 78 74 80a. Compute MAD for each set of forecasts. Given your results, which forecast appears to be more accurate? Explain.b. Compute the MSE for each set of forecasts. Given your results, which forecast appears to be more accurate?c. In practice, either MAD or MSE would be employed to compute forecast errors. What factors might lead a manager to choose one rather than the other?d. Compute MAPE for each data set. Which forecast appears to be more accurate?The following are the sales figures for 2018 through 2020 for a product. Data for ayear is available in two halves of the year, months January through June, and thenJuly through December (Half-year 2). Suppose we are interested in setting up a forecasting model using the exponentialsmoothing method for stationary processes with seasonality.a) Initialize the system based on the data provided for 2018 and 2019.b) Suppose the smoothing factors are ?= 0.1 and ?= 0.1. Forecast and update forthe first half of 2020 and then the second half of 2020 by incorporating the sales forthe first half of 2020 . Calculate the MAD based on 2020actuals and forecasts.c) Forecast sales for the two halves of 2021.